
Weekly S&P500 ChartStorm - Best Charts of 2025
Best-of the Weekly ChartStorm 2025: a carefully collated set of charts that capture the key lessons, trends, and shifts that happened this year...

Welcome to the latest Weekly S&P500 #ChartStorm!
n.b. This week it’s a slightly different focus than usual given the quieter time-of-year — this edition takes a look at some of the most notable and enduring charts from the past year (similar to this edition from the same time last year).
Hope you enjoy, and Best Wishes for 2026!
1. When it’s Obvious… This chart made the list because it illustrates a key rule of thumb in markets that I’ve seen playout over and over again. By the time an investment theme becomes “obvious”, it’s obviously wrong. As I highlighted earlier this year: “consensus at Goldman Sachs’ investment conference reckons the US will be the best-performing equity region this year. And that’s after a prolonged, substantial, and stretched run of relative outperformance by the USA vs global —and at a time where relative valuations are at a record deep discount for global vs US”
As noted last week, US equities have lagged significantly behind vs rest-of-world this year, and global stocks have actually put in very strong performance (particularly Europe and Emerging Markets). So it’s a reminder to take stock of your biases and question the consensus.

Source: Weekly S&P500 ChartStorm - 9 February 2025 [@MikeZaccardi]
2. No Place for Politics: Another mind-trap pitfall in investing is the constant noise and political bickering that seems to fill every feed — it has no place in investing, and this chart only served to hammer that point home. As I’ve previously noted: “History shows it’s best to leave politics out of investing; blind buy and hold beats holding during only one or the other party’s reign (and actually avoiding holding during recessions is a much more potent protector of wealth than avoiding one’s least favorite political party).”
So again, check your biases, stay focused on facts, and remain pragmatic.
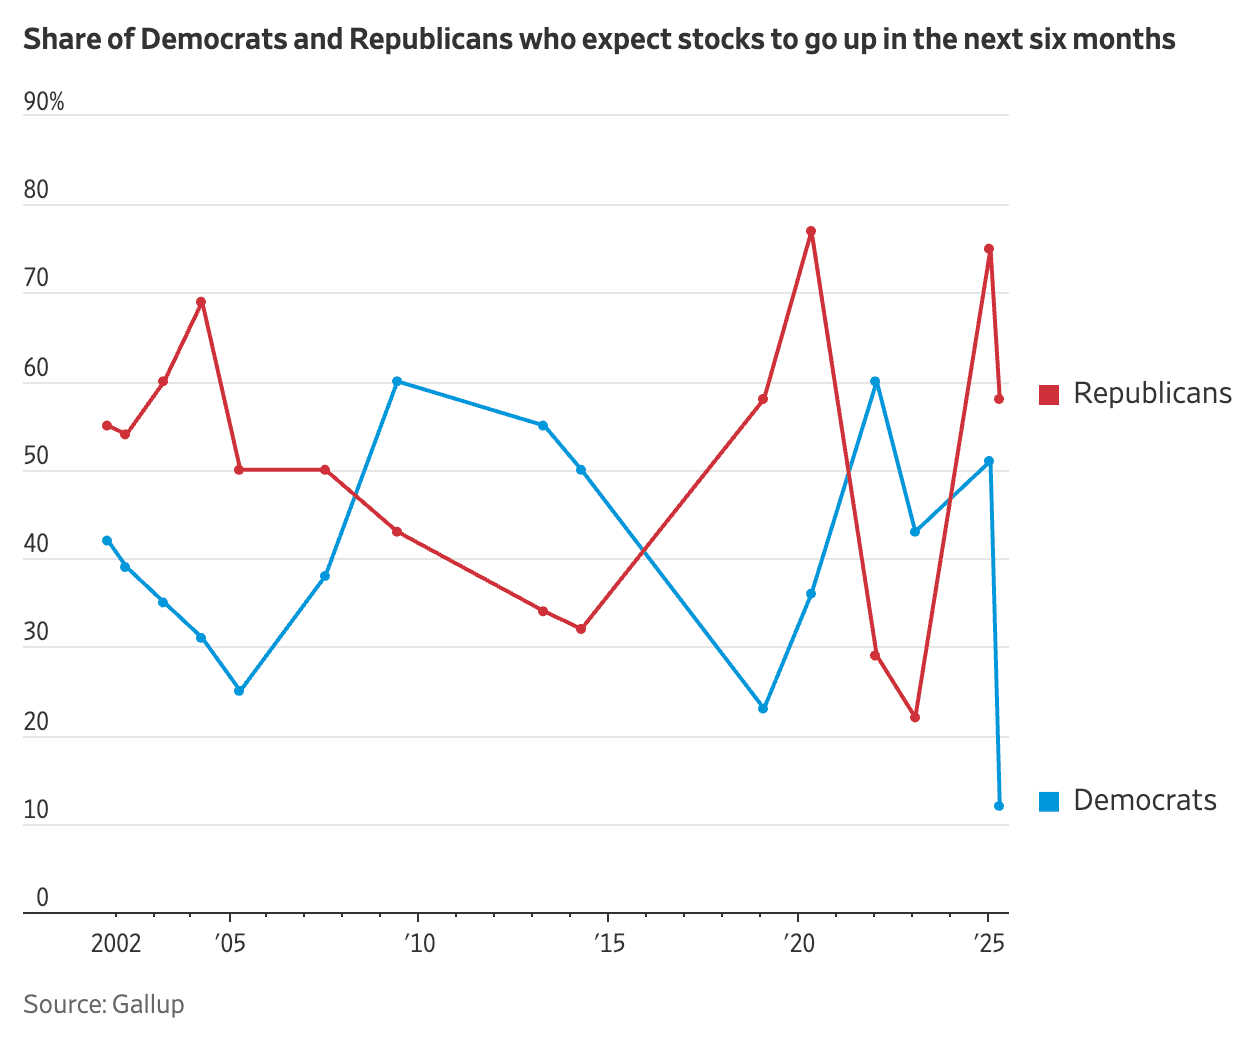
Source: Weekly S&P500 ChartStorm - 22 June 2025 [@GunjanJS]
3. Corrections & Bears: This one made the list for a couple of reasons. First of all, the Feb-April correction actually did go on to become a “bear” as the drawdown from the intraday high on the 19th of Feb to the intraday low on the 7th of April was -21%.
But second of all, it’s a prompt to have a think about what even is a “Bear Market”. The mainstream media definition is that it’s a drop in the Stockmarket of -20%. But here’s a question: would you feel differently about a drop of -20% which occurred quickly vs a decline of -20% which occurred over an extended period of time where the market trended lower? >> The point is it’s less about the label or the percentage, and more about the trend (and cycle). I would suggest thinking less about the idea of a bull or bear and more about the existence of an up vs down trend (or no trend).
Lastly, it also reminds us that dips can dip deeper, as I noted at the time: “it does serve as a cautionary of what could yet be still to come on the downside [so let’s not panic and get depressed, but also let’s definitely not be complacent; let us only be pragmatic].”

Source: Weekly S&P500 ChartStorm - 23 March 2025 [@RyanDetrick]
4. The Great Concentration: From the rise of big tech/mag-7 and on to the AI boom and magnificent run by Nvidia, this chart served as sign-of-the-times but also food for thought for both bulls and bears.
The bullish takeaway is that the biggest company/sector can stay on top for longer than you think, especially during times of great transition e.g. General Motors during the mass-adoption of automobiles. The bearish takeaway is that reaching the top can become pyrrhic victory e.g. Microsoft during the dot com bubble, and Exon Mobil during the 2000’s commodity boom.
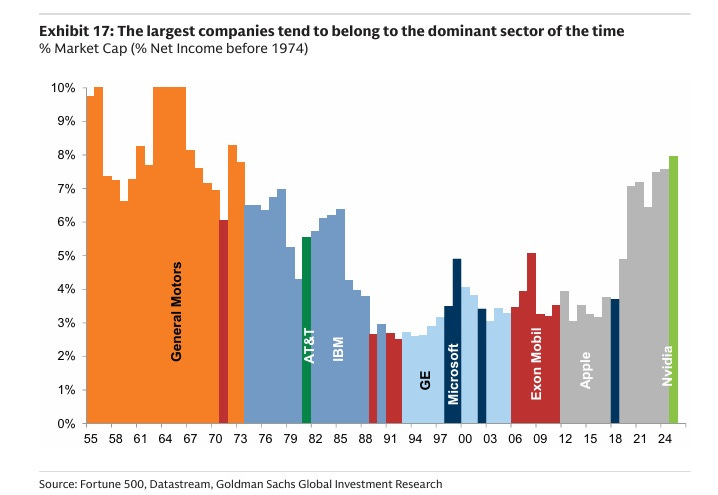
Source: Weekly S&P500 ChartStorm - Bubble Trouble? [@lhamtil]
5. Capex! Probably the best candidate for the Stockmarket word-of-the-year in 2025 would be “capex”. As the race for AI supremacy both within the USA and globally rages on, tech sector fixed asset investment has surged — crowding out capex by the rest of the market. For instance, commodity sectors have seen things go in the opposite direction.
And yes, I do think this chart says a LOT about where the risks and opportunities lie heading into 2026 (my view = big upside for underestimated commodities, big chance of disappointment for overhyped tech).
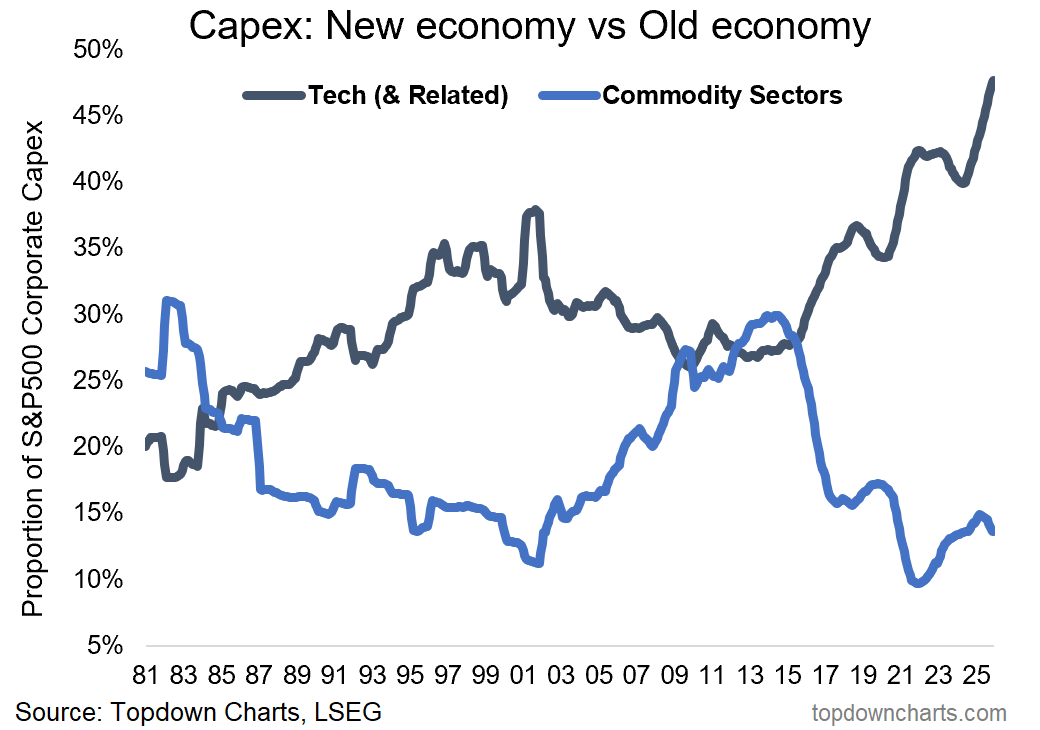
Source: Weekly S&P500 ChartStorm - 25 May 2025 [ Topdown Charts ]
6. The Great Growth Stock Shortage: Interestingly enough, and on a similar note, it appears we are seeing a glut of value stocks and a shortage of growth stocks. And on my numbers, value stocks are much cheaper than usual vs growth stocks (which is what you would expect if the previous statement were true).
But it’s also another angle on concentration and diversification: e.g. the top 10 stocks sum to 60% for the Russell 1000 Growth Index vs 17% for the Russell 1000 Value Index. And basically growth stocks are one big bet on tech, while value is more skewed toward traditional cyclicals (financials, industrials, energy, materials, real estate, old tech) and defensives.
p.s. the latest figures (28 Dec 2025) are Growth Stocks: 396, Value Stocks: 876.
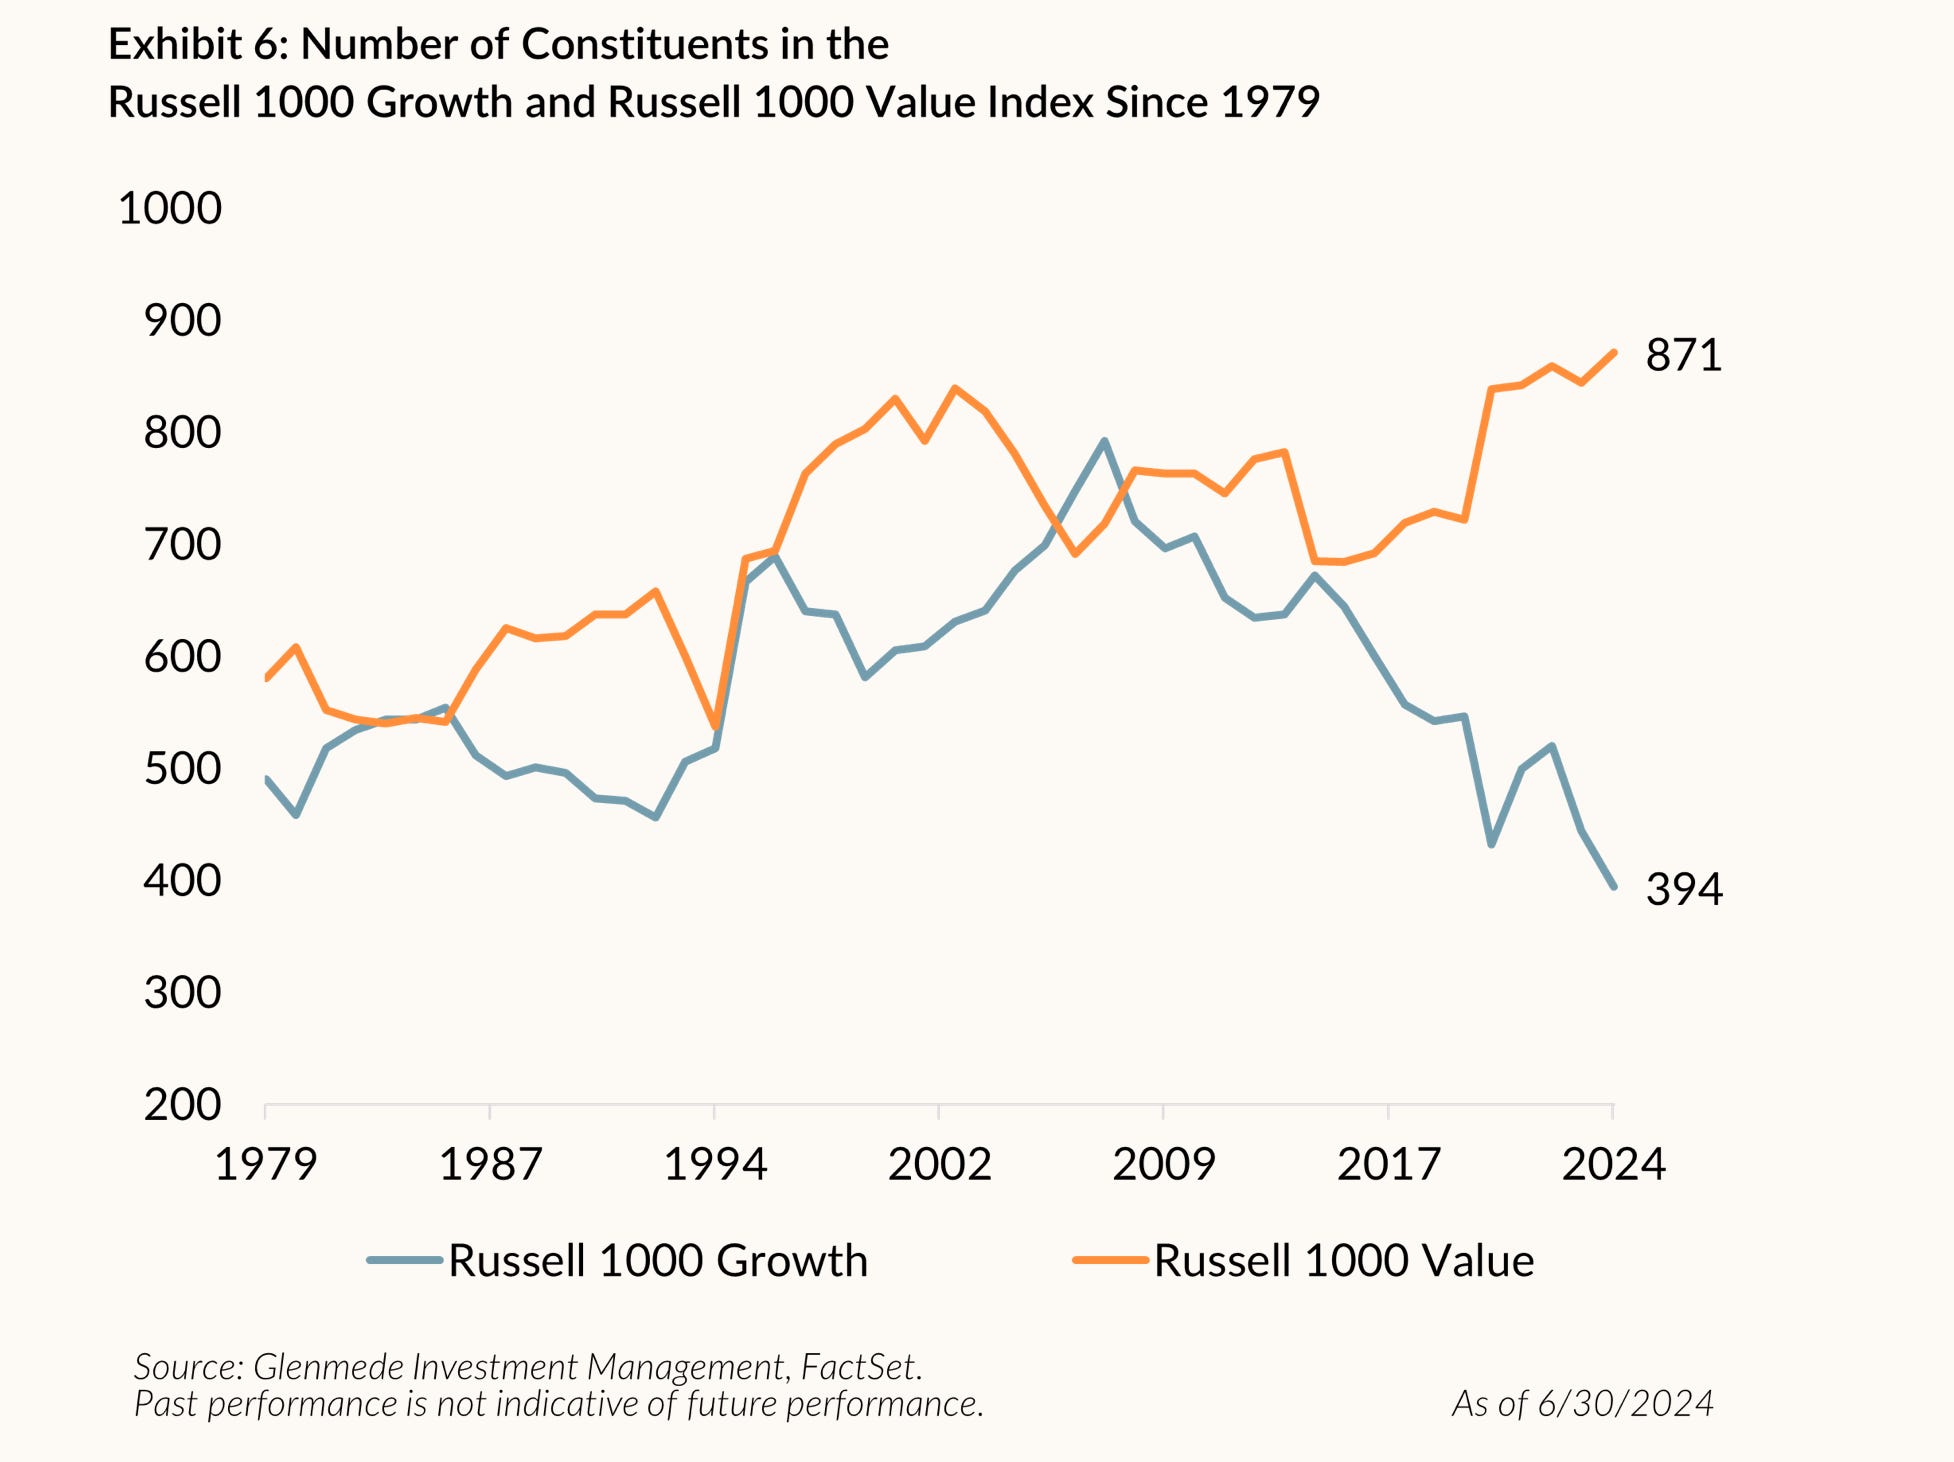
Source: Weekly S&P500 ChartStorm - 23 February 2025 [SnippetFinance]
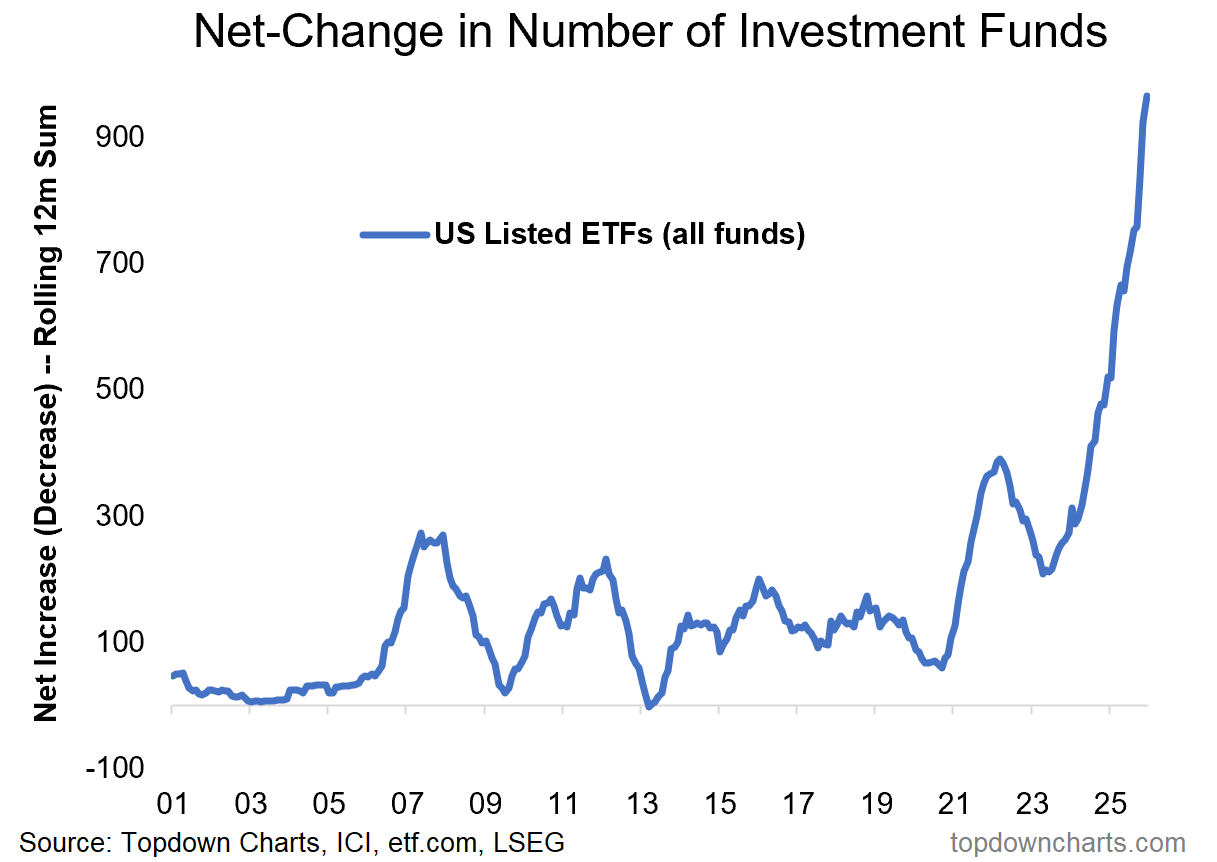
7. Fund Frenzy: Another sign-of-the-times chart — 2025 saw a record surge in ETF launches. Part of this is mutual fund conversions (converting mutual funds into ETFs due to better tax efficiency and easier access for investors), but even accounting for that, the surge is real and significant, and most notably involved a lot of highly speculative and exotic products.
Bigger picture this chart is basically a gauge of speculation and risk appetite, and is deeply cyclical e.g. the peak in 2007/08 vs trough in 2009. As with many sentiment type indicators, you have a better time buying when it’s troughed and turning up vs surging and climaxing after an extended run.
Source: Weekly S&P500 ChartStorm - 21 September 2025 [Topdown Charts]
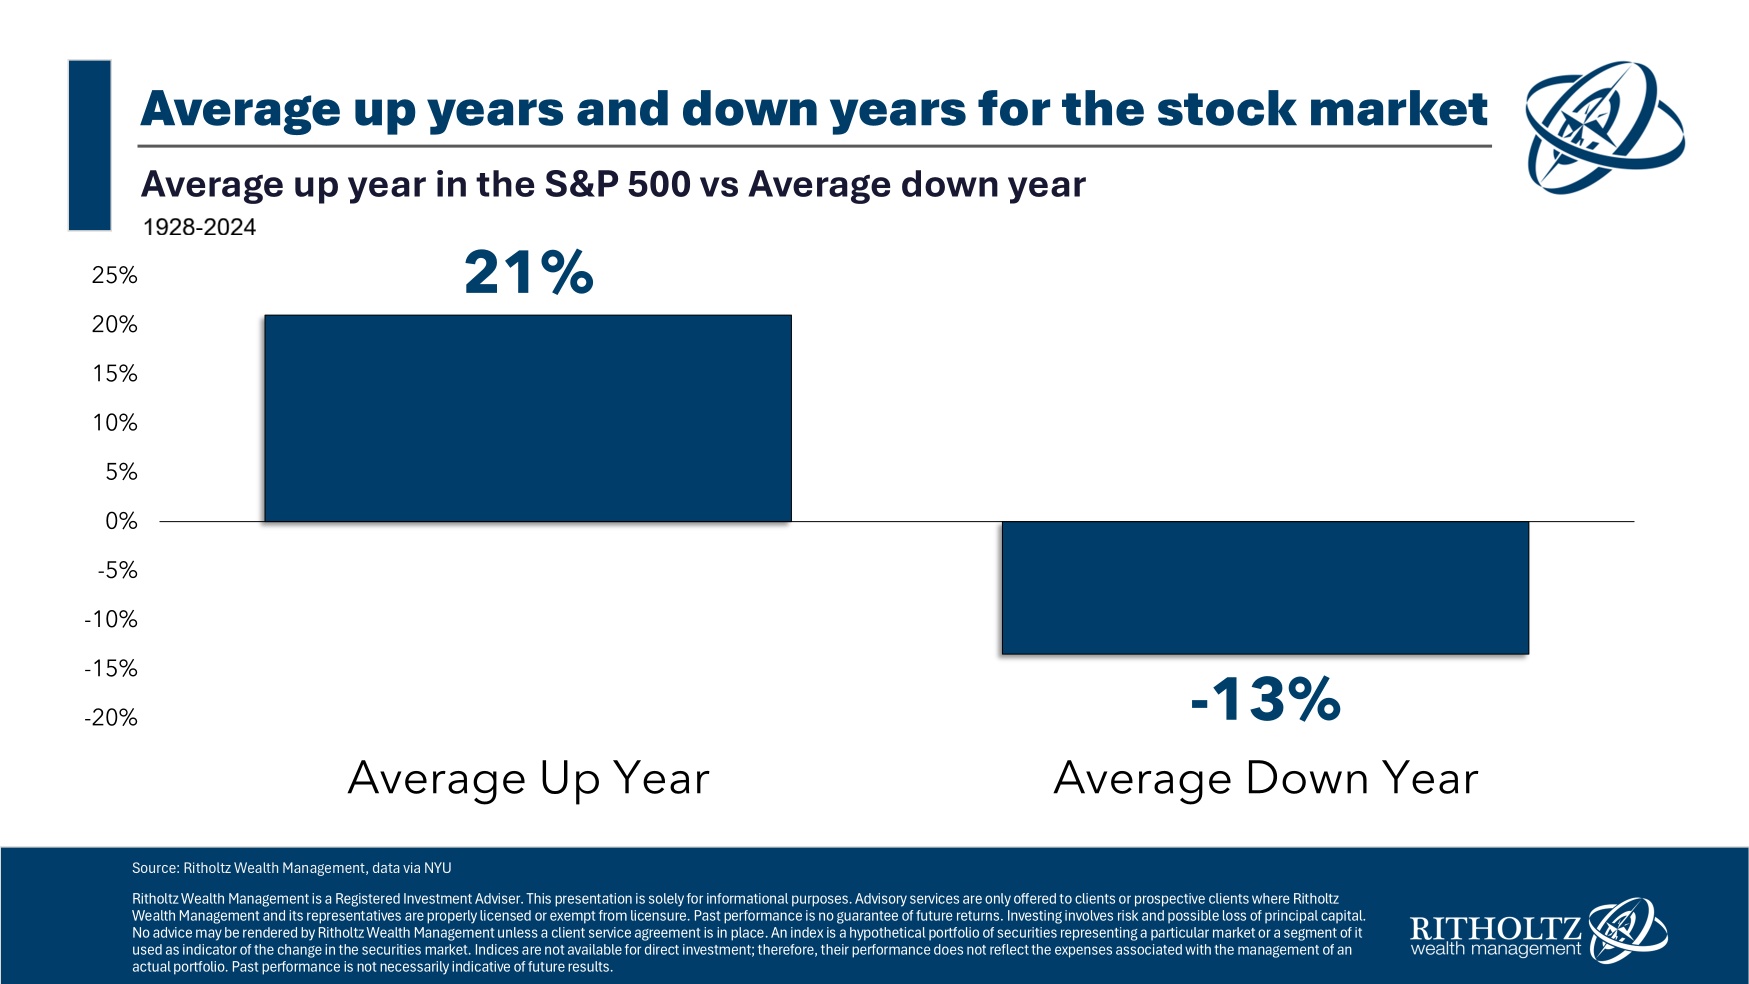
8. Average Years: This one is interesting because it provides a bit more depth on the averages. Over the long-run the average price change across all years is about +8%, but as usual, averages tend to be deceiving. The average during up years for the S&P500 was +21% vs -13% during down years. So if you were to estimate that the market will do 8% in a given year (i.e. just the long-term average) you’re probably going to be quite wrong even if the market goes up.
Source: Weekly S&P500 ChartStorm - 7 December 2025 [Ben Carlson]
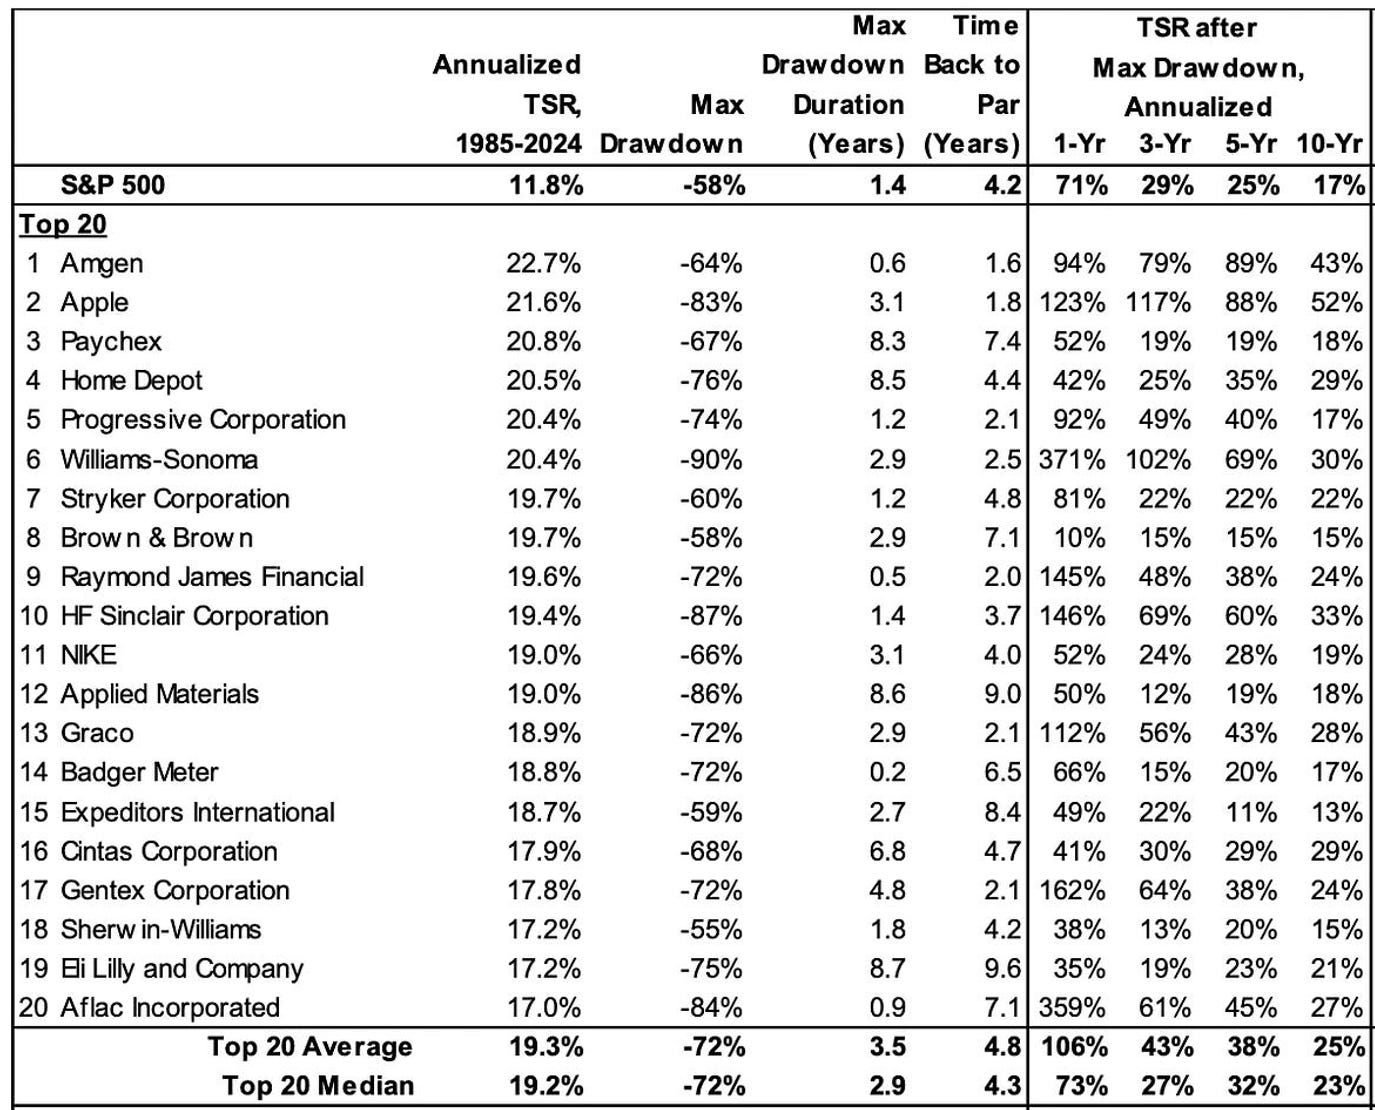
9. The Worst of the Best: This table lays out drawdown stats for some of the best performing stocks in recent history. It goes to show that not only do you have to pick the right stock, but you have to be able to hold-on and navigate through sometimes catastrophic (and drawn-out) declines in your portfolio during the process. There’s also something to be said about buying the best stocks at their worst time!
Source: Weekly S&P500 ChartStorm - 8 June 2025 [Sam Ro at TKer]
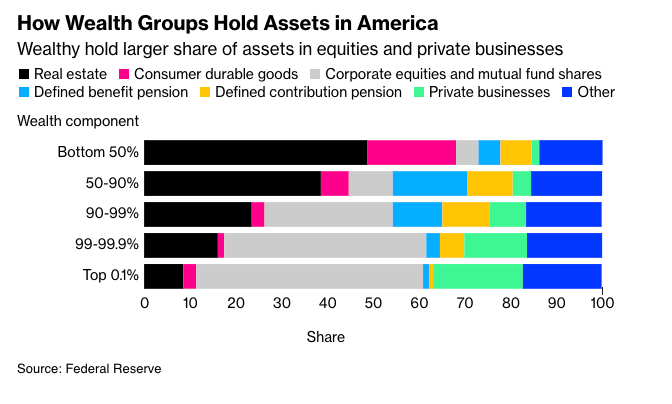
10. Rich Wealth vs Poor Wealth: Lastly, an interesting one which shows the difference in portfolio composition between poor wealth and rich wealth. The lower half has most of their net worth in property and things (cars, household effects); and very little in stocks or business. Contrast that to the 50-90% (mass affluent?), where equities and investment funds make up about 40% of their portfolios, while the upper 10% have most of their net worth in stocks/funds/business.
It’s interesting because there is some survivorship/generation cohort effects (e.g. age: if you hold your house for long enough and work + save for long enough your net worth goes up), clearly also some cause and effects (e.g. if you hold more appreciating assets your net worth goes up), and macro/political implications (big drops in stocks hurt the upper echelons much more vs the poor — who would be more hurt by housing downturns).
So it’s a reminder on the principles of building wealth, but also a snapshot into the lay of the socio-economic landscape…
Source: Weekly S&P500 ChartStorm - 27 April 2025 [@unusual_whales]
Thanks for reading. Please feel welcome to share this with friends and colleagues.
Reminder: 2025 End of Year Special Report
In case you missed it, check out my 2025 End Of Year Special Report from Topdown Charts — includes 38 of my best, worst, and favorite charts of 2025 and the must-see macro/market charts to have on your radar in 2026 [Free Download]
Thanks for your support and interest this year!
—
Best wishes,
Callum Thomas
Founder & Editor of The Weekly ChartStorm
and Head of Research at Topdown Charts
Twitter/X: https://twitter.com/Callum_Thomas
LinkedIn: https://www.linkedin.com/in/callum-thomas-4990063/
NEW: Other services by Topdown Charts
Topdown Charts Professional —[institutional research service]
Topdown Charts Entry-Level Service —[entry-level version]
Weekly S&P 500 ChartStorm —[US Equities in focus]
Monthly Gold Market Pack —[Gold charts]
Australian Market Valuation Book —[Aussie markets]
Which one is your favorite?
CAPEX ... the LARGE divergence is driving us to value ... metals ...