
Weekly S&P500 ChartStorm - 22 June 2025
This week: noise levels, fund flows, seasonality snippets, global vs US stocks, global vs US investors, partisan market views, active vs passive, Fed sour spot...

Welcome to the latest Weekly S&P500 #ChartStorm!
Learnings and conclusions from this week’s charts:
The market is facing a “Wall Of Worry” as noise levels run high.
Fund flows show a transitional phase in the market.
Seasonality is quite negative near term (June swoon?).
Fund managers expect cheap global stocks to outperform vs US.
US investors allocate ~5x more to equities as most global investors do.
Overall, aside from the very interesting perspective and stats snippets in this week’s edition, the major theme for the immediate term outlook is one of worries, pessimism, and a sour spot. The long-term optimist will say that walls of worry are built to be climbed, and that’s probably a fair bet given the longer-term trend in the stockmarket over time, but at the same time there are some legitimate concerns at the moment…
UPDATE: check out the new “Getting Started” section (how to make the most of your subscription to the Weekly ChartStorm), and Reviews & Testimonials page.
1. Economic Noise: The noise levels facing investors right now remains deafening, and that’s clearly contributing to the S&P500 getting stuck in the mud around overhead resistance. There’s mixed macro signals, fiscal showdowns, monetary policy stare downs, tariff tinkering, and of course geopolitics (e.g. just as I go to write the US has dropped bombs on Iran’s nuclear sites; and it’s anyone’s guess as to how the response chain will unfurl from here). This is what we in the business call the Wall Of Worry. And to be fair, markets routinely climb walls of worry, but one thing is clear: we live in interesting times right now.

Source: Topdown Charts
2. Going Flows: It was Sir John Templeton who said “bull markets are born on pessimism, grow on skepticism, mature on optimism, and die on euphoria” —and this chart traces some of that cycle in practice with US based equity fund flows. As I previously documented at length, late last year markets were in euphoria (e.g. my euphoriameter indicator reached a record high), but before you get excited about the emerging pessimism displayed in this chart… it’s worth noting that this transitional phase is dangerous, the path to peak pessimism (and the birth of new bull markets) is most often a painful one.
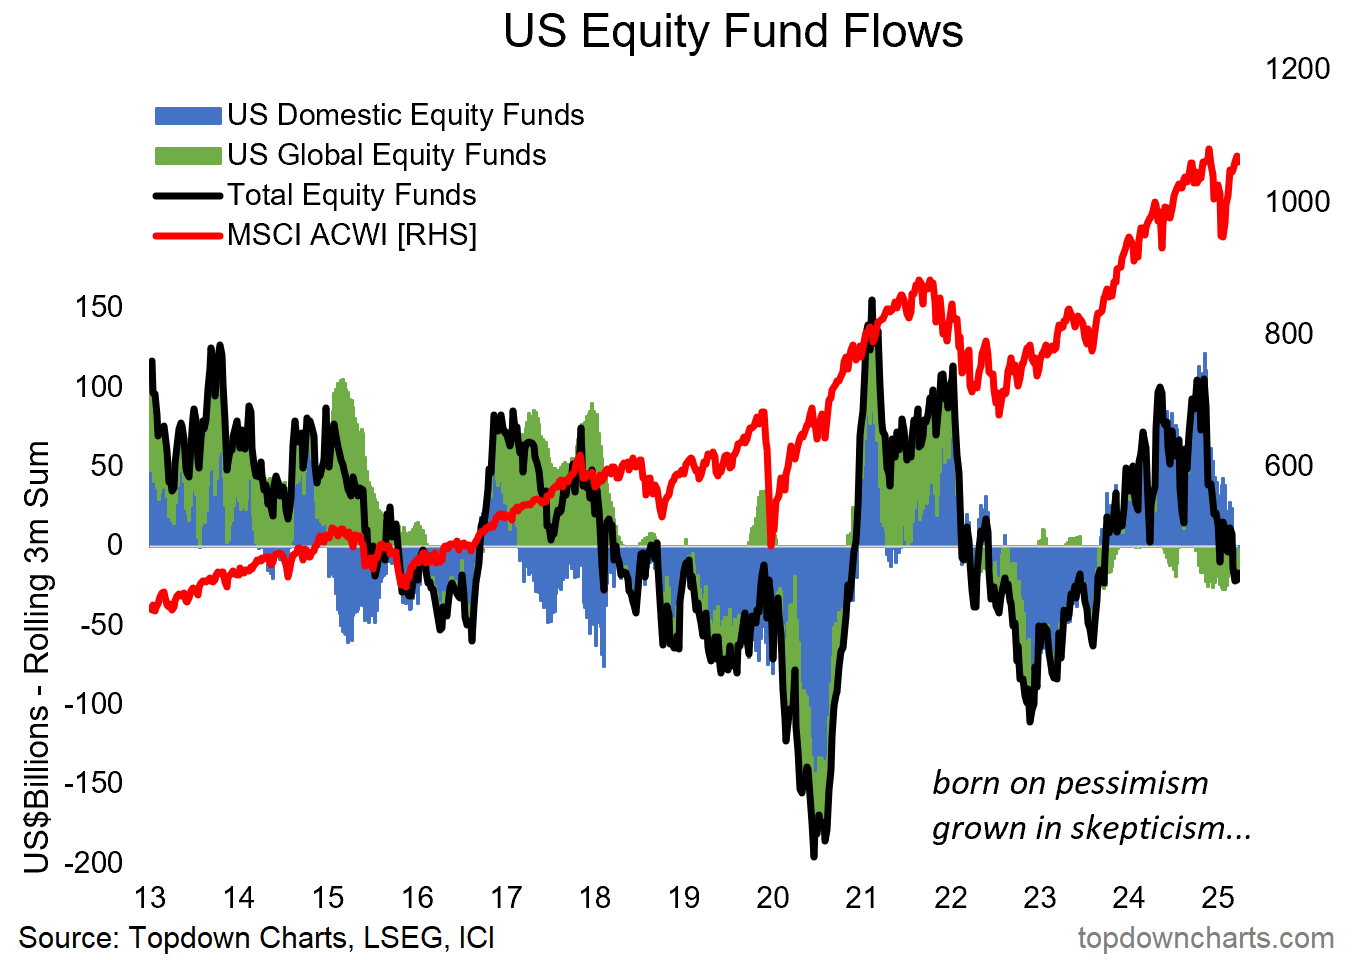
Source: Topdown Charts Professional
3. June Swoon? And in terms of the immediate outlook, let’s not forget about the June Swoon —the second half of June has historically been one of the weakest patches of the calendar year (topped only by September).
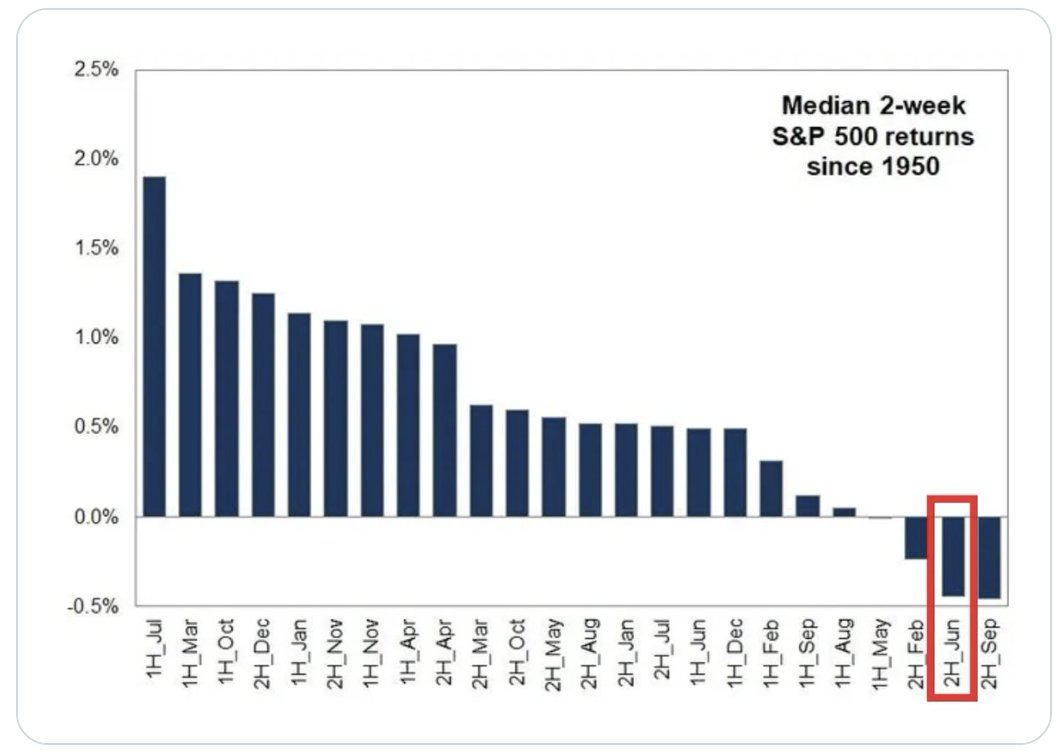
Source: @SethCL
4. Summer Slump: And for that matter the summer doldrums are a thing.

Source: @LarryAdamRJ
5. Bull vs Bear Market Seasonality: Interestingly, the late-June patch tends to be notably weak/volatile for both bull AND bear markets (worse for bear market years; which in this case is classified as years where the market ended the year down). So we’ve got a wall of worry, a transitional market mood, and soft seasonality to contend with in the coming weeks.

Source: Off-Topic ChartStorm - Sell in May?
6. Global Expectations: I find this chart particularly interesting because I shared a chart earlier this year showing over 50% of institutional investors expecting *US* equities to be the best performing market. Interesting how price affects sentiment.
