
Weekly S&P500 ChartStorm - 25 May 2025
This week: technical check, narratives, new highs, shorts, valuations, healthcare, profitability, missing days, reshoring, tech vs commodity capex...

Welcome to the latest Weekly S&P500 #ChartStorm!
Learnings and conclusions from this week’s charts:
The S&P500 sold-off from resistance (and overbought conditions).
It’s now been 67-days since the last new all-time high.
Stocks are expensive, bonds are cheap.
Surging short interest shows increased interest in shorting.
Reshoring talk is rising, tech capex is dominating (got commodities?).
Overall, it seems like the sell-off that everyone was waiting for has finally arrived. Technically speaking the market was ripe and primed for a pullback, and simply awaiting some news or narratives as a reason/excuse. With the ebb and flow of policy pronouncements and macro narratives, as I outline this week; it brings to mind a new acronym “RTFL” (Range Trading For Longer).
1. Resistance: Just as new highs seemed within reach, and just as that big round 6000 number was in sight, and just as 50-day moving average breadth reached overbought levels, we got pullback. Plenty of supports in close proximity e.g. 5800, the 200-day average, and even stronger support close by at 5600. But one awkward thing for bulls is that this kind of looks like a lower high.

Source: Callum Thomas using MarketCharts charting tools
2. VIX Base: On a similar note the VIX is ticking up off the lows and VIX sentiment is turning up after resetting back to complacent levels.

Source: SubuTrade
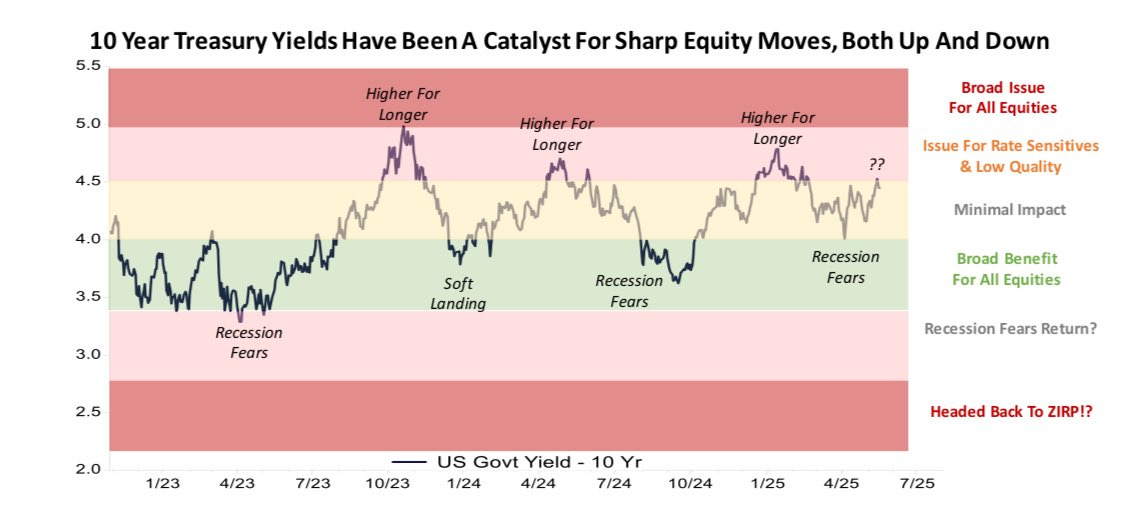
3. Narrative Rotation: The “reason” or excuse for the sell-off is arguably a mix of higher bond yields as we continue to rotate between macro-narratives of recession fears vs resurgent growth/inflation and the headwind of higher yields. And then there’s the usual Trump/tariff threats which are likewise going through their own process of ebbing and flowing. Range trade for longer?
Source: @MichaelKantro
4. Waiting for New Highs: Back on the topic of waiting for new all-time highs, it’s now been 67 trading days since the last new all-time high. And if we go back to those narratives from earlier in the year with Bessent and the “period of detox”, maybe the tariff and reform game is a situation of ease-up when the market’s down, and crack-down when the market’s up. Even if that’s not the plan that’s kind of what it looks like so far, and that would be a strong case for range-trading-for-longer (RTFL?).
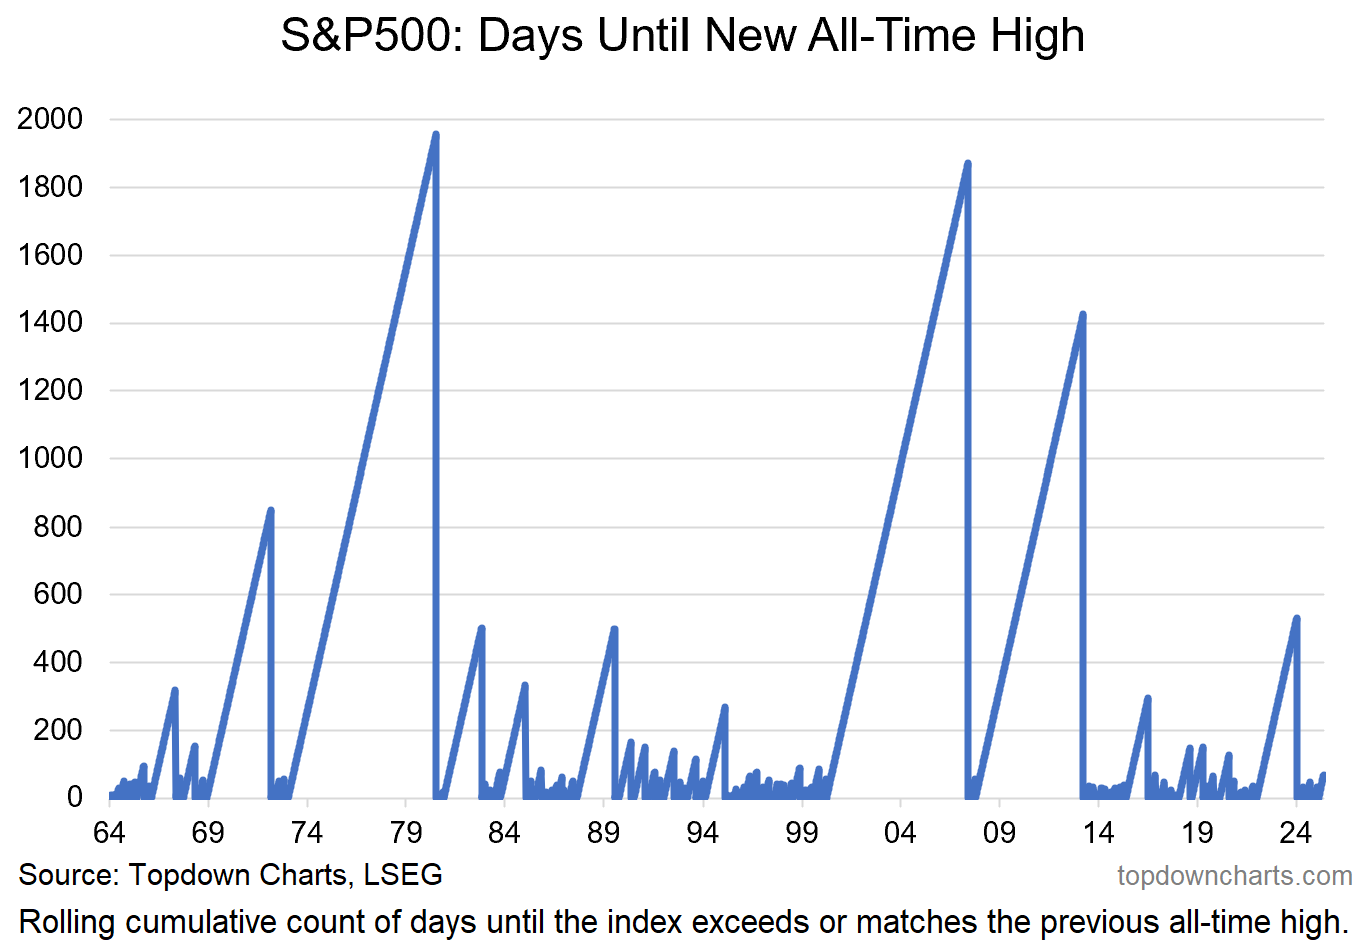
Source: Topdown Charts
5. Valuations: While stocks may not have managed to make a new all-time high, valuations are still at the upper end of the range. Bonds on the other hand are an entirely different story; cheap on my indicators. And the interesting thing is bonds are about as hated as it gets at the moment; just about every headline and tweet is bashing bonds. Sentiment signal?

Source: Chart of the Week - Stocks vs Bonds
6. Big Short: This one is fascinating as it goes to show you can have a market and set of conditions that go to an extreme and persist there for some time, only to rapidly revert. Shorting is back. Whether this is directional calls on the stockmarket as a whole or expressing winner vs loser calls in the age of tariffs and policy shocks (e.g. healthcare) is certainly a matter of intrigue and probably a bit of both.
