
Weekly ChartStorm - The 2022 Top
Special Edition: surveying the signs and signals from the 2022 market peak -- a retrospective look at market cycle analysis principles...

Welcome to the latest Weekly S&P500 #ChartStorm!
NOTE: I’m traveling this week so I’ve put together a special edition that I’ve been sitting on for some time. This week looks at a selection of charts that helped flag or warn of the S&P 500 top in 2021/22 (as a reminder: the market peaked at a closing high of 4796.56 on the 3rd of January 2022 before rolling over into a bear market with a top-to-bottom drawdown of -27.5% —bottoming in October of the same year, but only reclaiming the highs in early 2024 (basically 2-years to get back to even)).
I think this is useful as a (timely?) retrospective + learning exercise, as well as a prompt to consider process and strategy in general.
(and p.s. I’ve also got a 2022-trough note up my sleeve: charts that helped pick the low — I’ll look to also release that in coming weeks, because it’s just as interesting… and helps manage my travel/workflow balancing act!)
NOTE: these charts have *NOT* been updated, they are shown as we saw them at the time (so you can see exactly the information we had before us at that time + my comments from back then).
1. Global Early Warning Signal: This one is great because it hammers home the point that you can’t ignore what’s going on in the rest of the world. Global equities peaked at resistance and rolled over, with deteriorating breadth — that’s as clear a red flag as it gets (a key fundamental/macro driver was rest of world pivoting to rate hikes as inflation surged). The principle here is to pay attention to what price is telling you, and stay alert to what’s happening globally.
“Similar thing at the global level -- a quarter of countries (main benchmarks) are trading below their respective 200-day moving averages, and global equities ex-US peaked months ago...”

Source: Weekly S&P500 ChartStorm - 26 December 2021 [ @topdowncharts ]
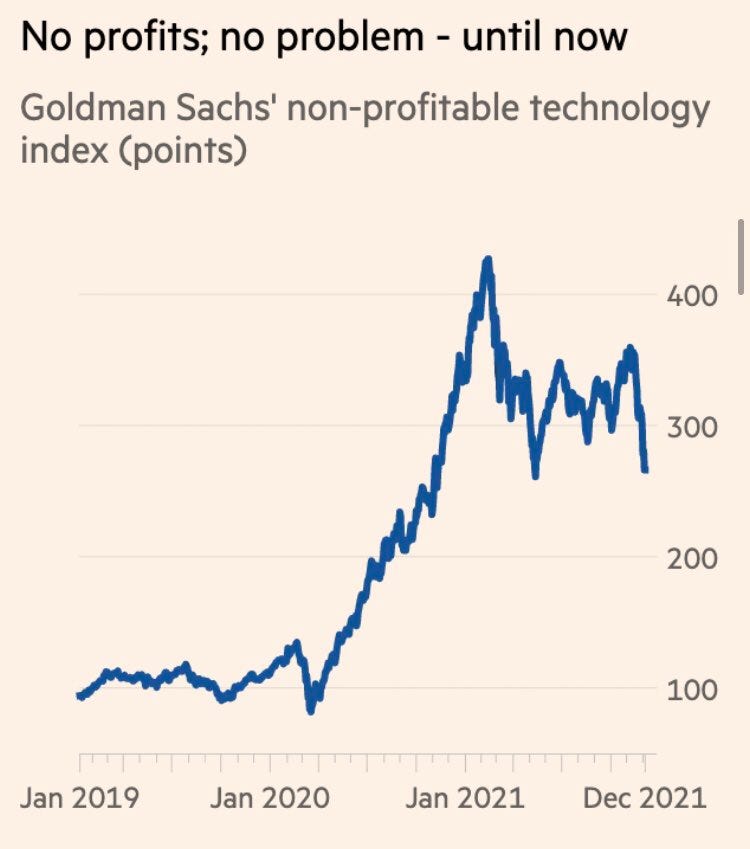
2. No Profits? No, Problem: This one is kind of similar because it told us the mood was changing well in advance of the peak in the S&P500. I would say the principle here is again pay attention to the information in price, especially with regards to the most speculative and lower quality parts of the market.
“Seems like there may be a transition from the line "no profits? no problem!" to "no profits? no, problem!"”
Source: Weekly S&P500 ChartStorm - 12 December 2021 [ RobinWigg ]
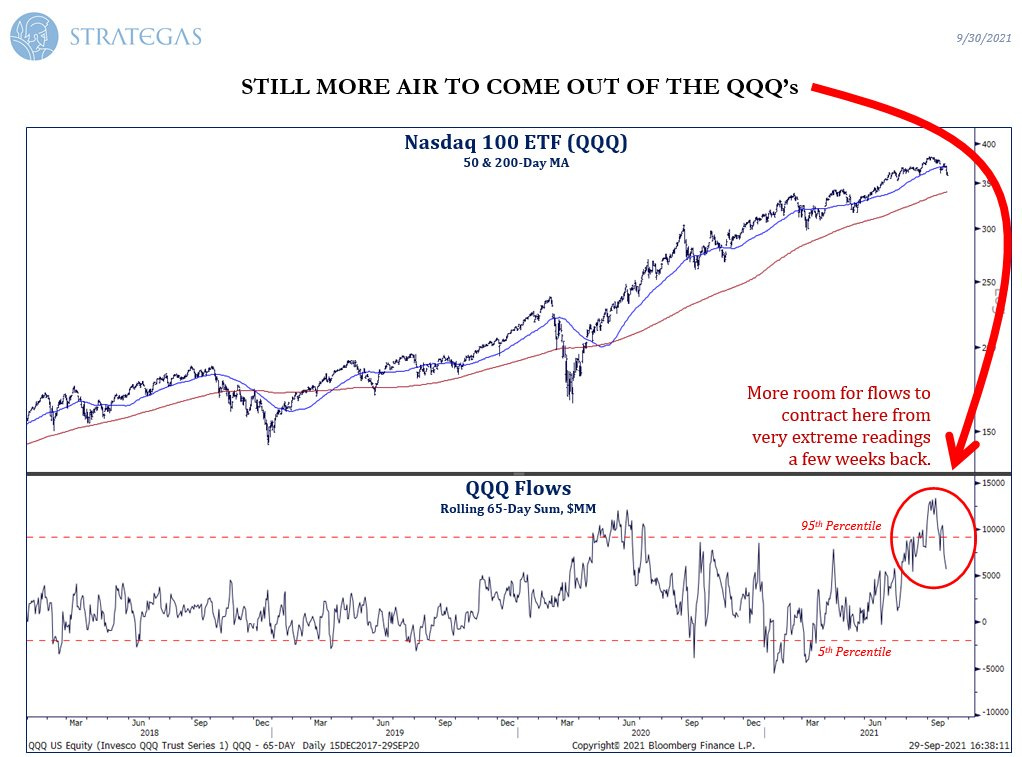
3. Go With the Flow: As noted in the original comment below, when you see a climax in a flows/sentiment indicator late in an extended trend, that’s a big warning sign. The key principle here is with flows/sentiment/positioning indicators, the big signal comes when it reaches an extreme and then turns the corner.
“One trigger of the selloff has been the damage done to growth stocks by the pop up in bond yields… that arguably comes at the worst possible time for the Nasdaq where massive inflows showed extremes in sentiment. I would be haste to point out that a euphoric reading like what we saw in recent weeks on this chart means an entirely different thing at the later stages of a trend (i.e. contrarian bearish), vs the beginning stages (i.e. the surge in flows in 2020 was bullish - a sign of strong momentum following a turning point). Could well be another turning point for tech stocks.”
Source: Weekly S&P500 ChartStorm - 3 October 2021 [ @verrone_chris ]
4. China Tech Harbinger: Another one for price and paying attention to global —as it turned out, the peak in the Nasdaq was right bang on with this chart (and tech stocks saw a much deeper drawdown in 2022). The principle here again is to be mindful of intermarket analysis, especially when it has to do with the same sector.
“Chinese tech stocks are down about -60% since peaking in February this year. We could explain this away on the basis of liquidity and regulatory tightening in China… but then again, maybe they are just a few steps ahead e.g. prospective regulatory scrutiny of big tech in the US, global tax rules, and recent Fed pivot away from “transitory inflation“ to openly discussing accelerated tapering of QE and rate hikes in 2022.”

Source: Weekly S&P500 ChartStorm - 5 December 2021 [ @SofiaHCBBG ]
5. Margin Peak: Another sign of a peak in speculation (and indirectly measuring the beginning stages of financial conditions tightening). I would note though that while the rate of change in margin debt (a better indicator than just raw level) peaked earlier in the year, the total level of margin debt actually rebounded and only truly peaked in October 2021.
So there’s 2 things there: one is to be paying attention to useful data like this, but the second is to make sure you take it in with the right context, we did get a sell signal from the rate of change in margin debt, but this chart was actually telling us about a local peak (with the true peak coming a couple of months later).
“Margin debt dropped in July (yeah I know, that’s a while ago, and that’s one downside of this data series - it’s released monthly with about a 1-month lag… one of those little quirks that is worth factoring in if you’re building trading algorithms!). Anyway, the key point is that this has sometimes, but not always, been a harbinger of troubling times for markets.”

Source: Weekly S&P500 ChartStorm - 29 August 2021 [ @TheOneDave ]
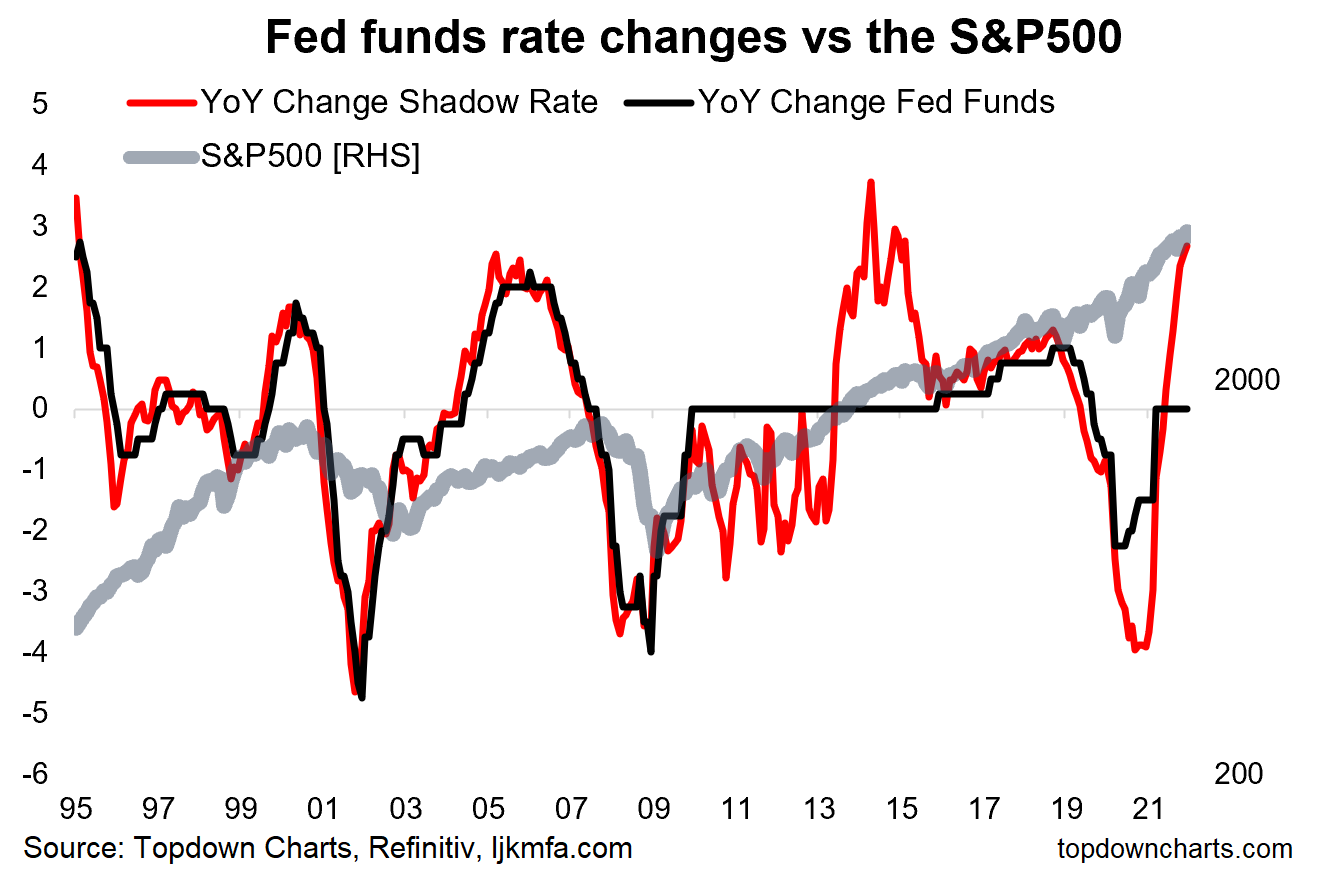
6. Fed Pivot to Tightening: Surging inflation finally forced the Fed to admit its problems late in 2021, with the tapering of QE announcement (and rate hikes in 2022). This was captured clearly in the chart below by tracking the “shadow Fed funds rate” — which incorporated the effects of QE. The principle here is to definitely pay attention to monetary factors, and to dig beyond just the standard indicators and way of looking at things.
“This chart shows the annual rate of change in the Fed Funds rate, along with the same for the “shadow fed funds rate“ (which adjusts for the impact of QE). As you can see things have already turned the corner.”
Source: Weekly S&P500 ChartStorm - 2 January 2022 [ Topdown Charts ]
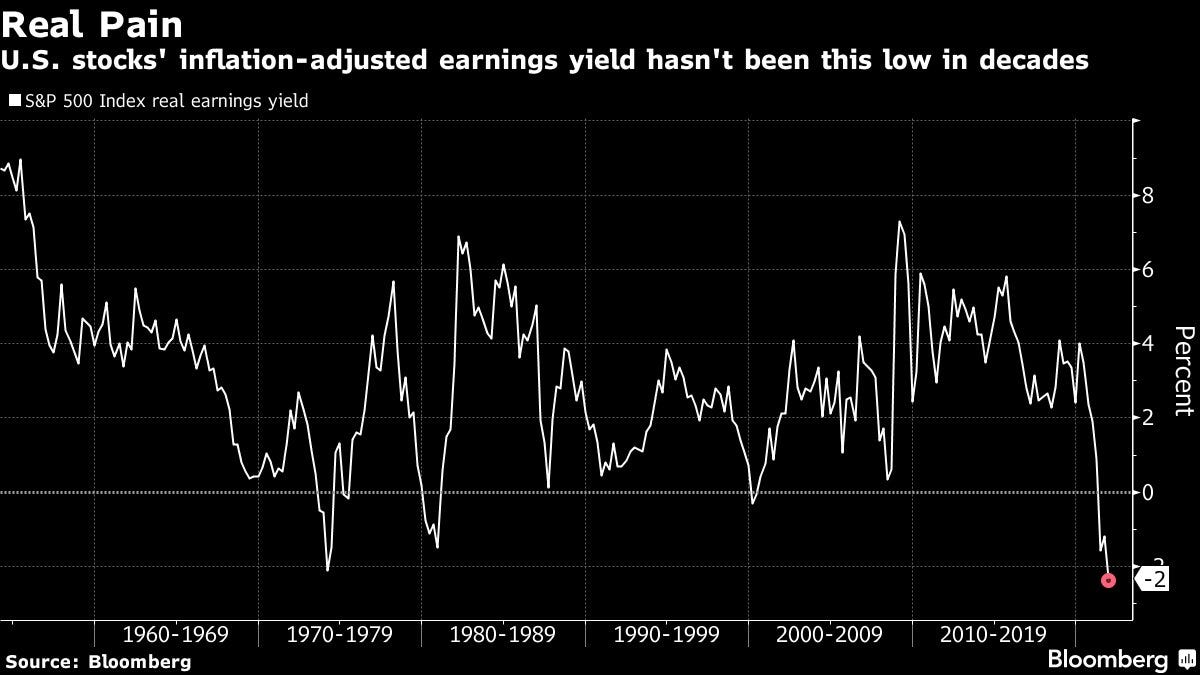
7. Real Low Real Yield: Another reflection of the surge in inflation (which was infamously described as transitory — and it was in no small part the Fed policy error that blew the mini bubble in 2020/21 and burst in 2022… by running policy too easy for too long, and then scrambling to tighten only after realizing its error).
This chart showed the “real earnings yield” — which both captured the inflation issue (high inflation makes it go low/negative) and valuation issue (low earnings yield = high valuations). The principles here are again to be looking at alternative indicators, but also to think independently vs consensus and conventional wisdom on the macro front.
“Speaking of the Fed & Inflation, here's the "real yield" for the S&P500... Historically whenever it approached or fell below 0% things tended not to work out too well (...unless you like bear markets!).”
Source: Weekly S&P500 ChartStorm - 12 December 2021 [ @Theimmigrant84 ]
8. Valuation Heights: Valuations tell us about possibilities — when valuation indicators are very cheap it tells us about upside possibilities (which can be realized when the other puzzle pieces fall into place) …whereas when valuations are very expensive it tells us about downside possibilities (given the right/wrong catalysts).
The key principle is you need to have visibility and clear-eyed awareness of where valuations are and what it means for future possibilities. In the context of where valuations got to in late 2021, you would have been a fool not to pay closer attention to risk flags.
“Staying with valuations, here’s one of my all time favorite charts — the PE10 ratio across the major chunks of global equities — shows the USA out there in a league of its own…”
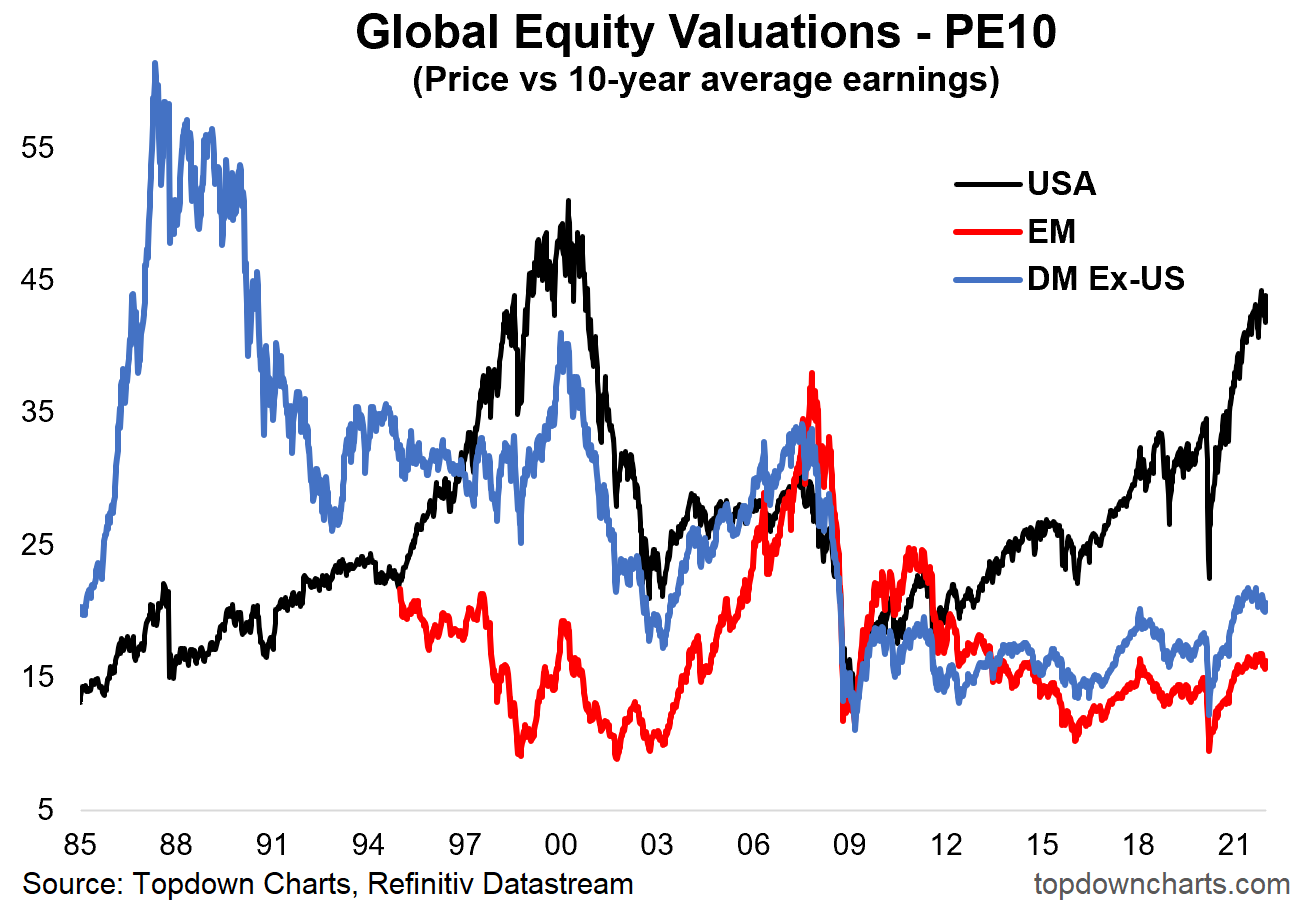
Source: Weekly S&P500 ChartStorm - 9 January 2022 [ @topdowncharts ]
9. Big Stocks Big Price: This one kind of speaks for itself, but basically the valuations of the biggest stocks went to dot-com levels and then (important) rolled over. Similar to sentiment indicators (and you might argue that valuation indicators are actually sentiment information), the real signal comes when it goes to an extreme and then turns the corner (as explained here).
“Speaking of valuations -- and kicking off a look at a selection of valuation charts is a very interesting and familiar perspective of the biggest 10 stocks in the index. History rhymes?”
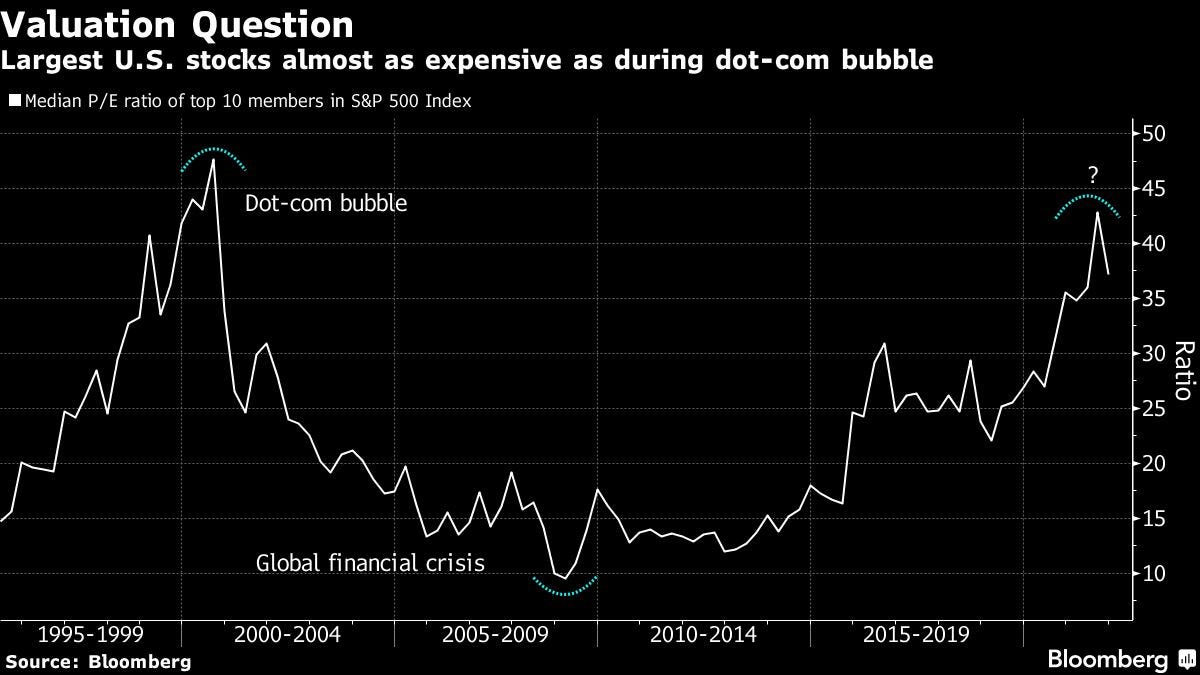
Source: Weekly S&P500 ChartStorm - 9 January 2022 [ @business ]
10. Value Breadth Extreme: This one provides a different angle by looking at a different indicator and looking at breadth — this is a lesson in looking at multiple sources of information to confirm, and taking innovative approaches to analyzing data to generate unique insights.
“More and more stocks are entering a new stratosphere of valuation (albeit profit margins are higher and interest rates are lower).”
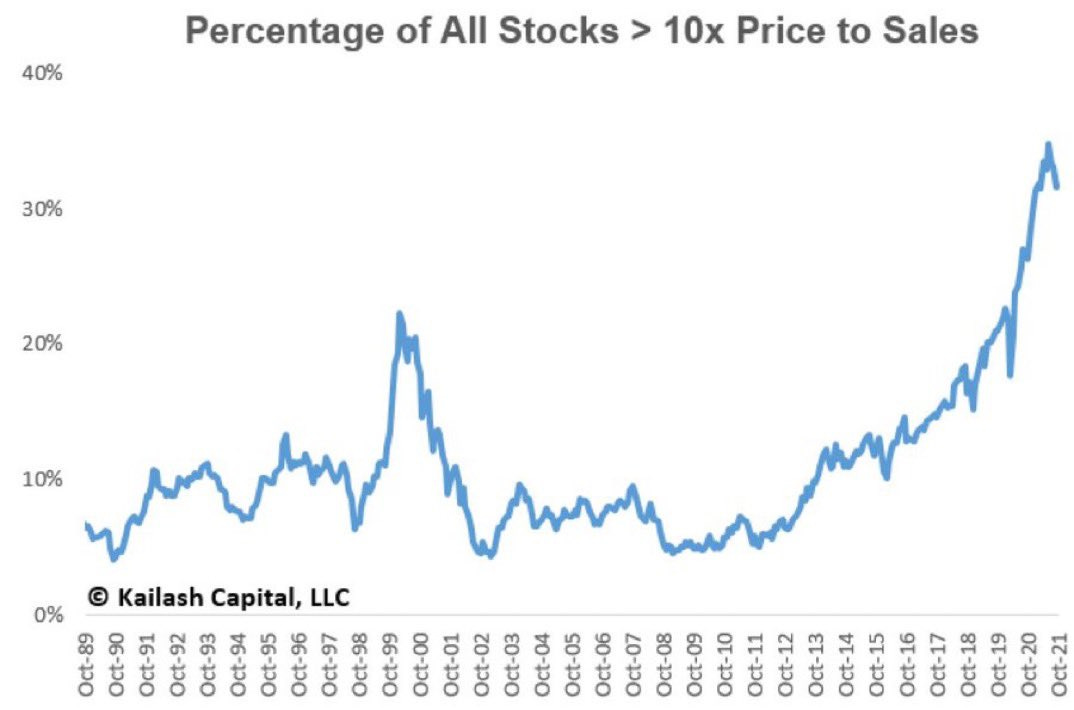
Source: Weekly S&P500 ChartStorm - 5 December 2021 [ @KailashConcepts ]
11. Expected Returns: Everyone likes to beat up expected returns analysis like this, but in this case my ones here proved to have useful tactical insights (even though they are usually used as strategic inputs). This run of expected returns not only warned us of the coming downside in stocks, but also in bonds (and 2022 was uniquely challenging for asset allocators as both stocks and bonds declined — while commodities [one of the few positives on the table] did well and acted as the real hero on diversification).
The principle here is to not let your bias make you ignore what might turn out to be good and useful information, but also to think flexibly about asset allocation and consider alternative diversifiers when it looks like the usual ones might not do their job.
“Finally, a check-in on expected returns. Going off this chart you’d skew into global ex-US equities, commodities, and EM fixed income… almost the opposite of what has done the best over the past decade (US equities and treasuries), and certainly - by most people’s estimations: venturing further out the risk curve. Challenging times ahead for asset allocators.”
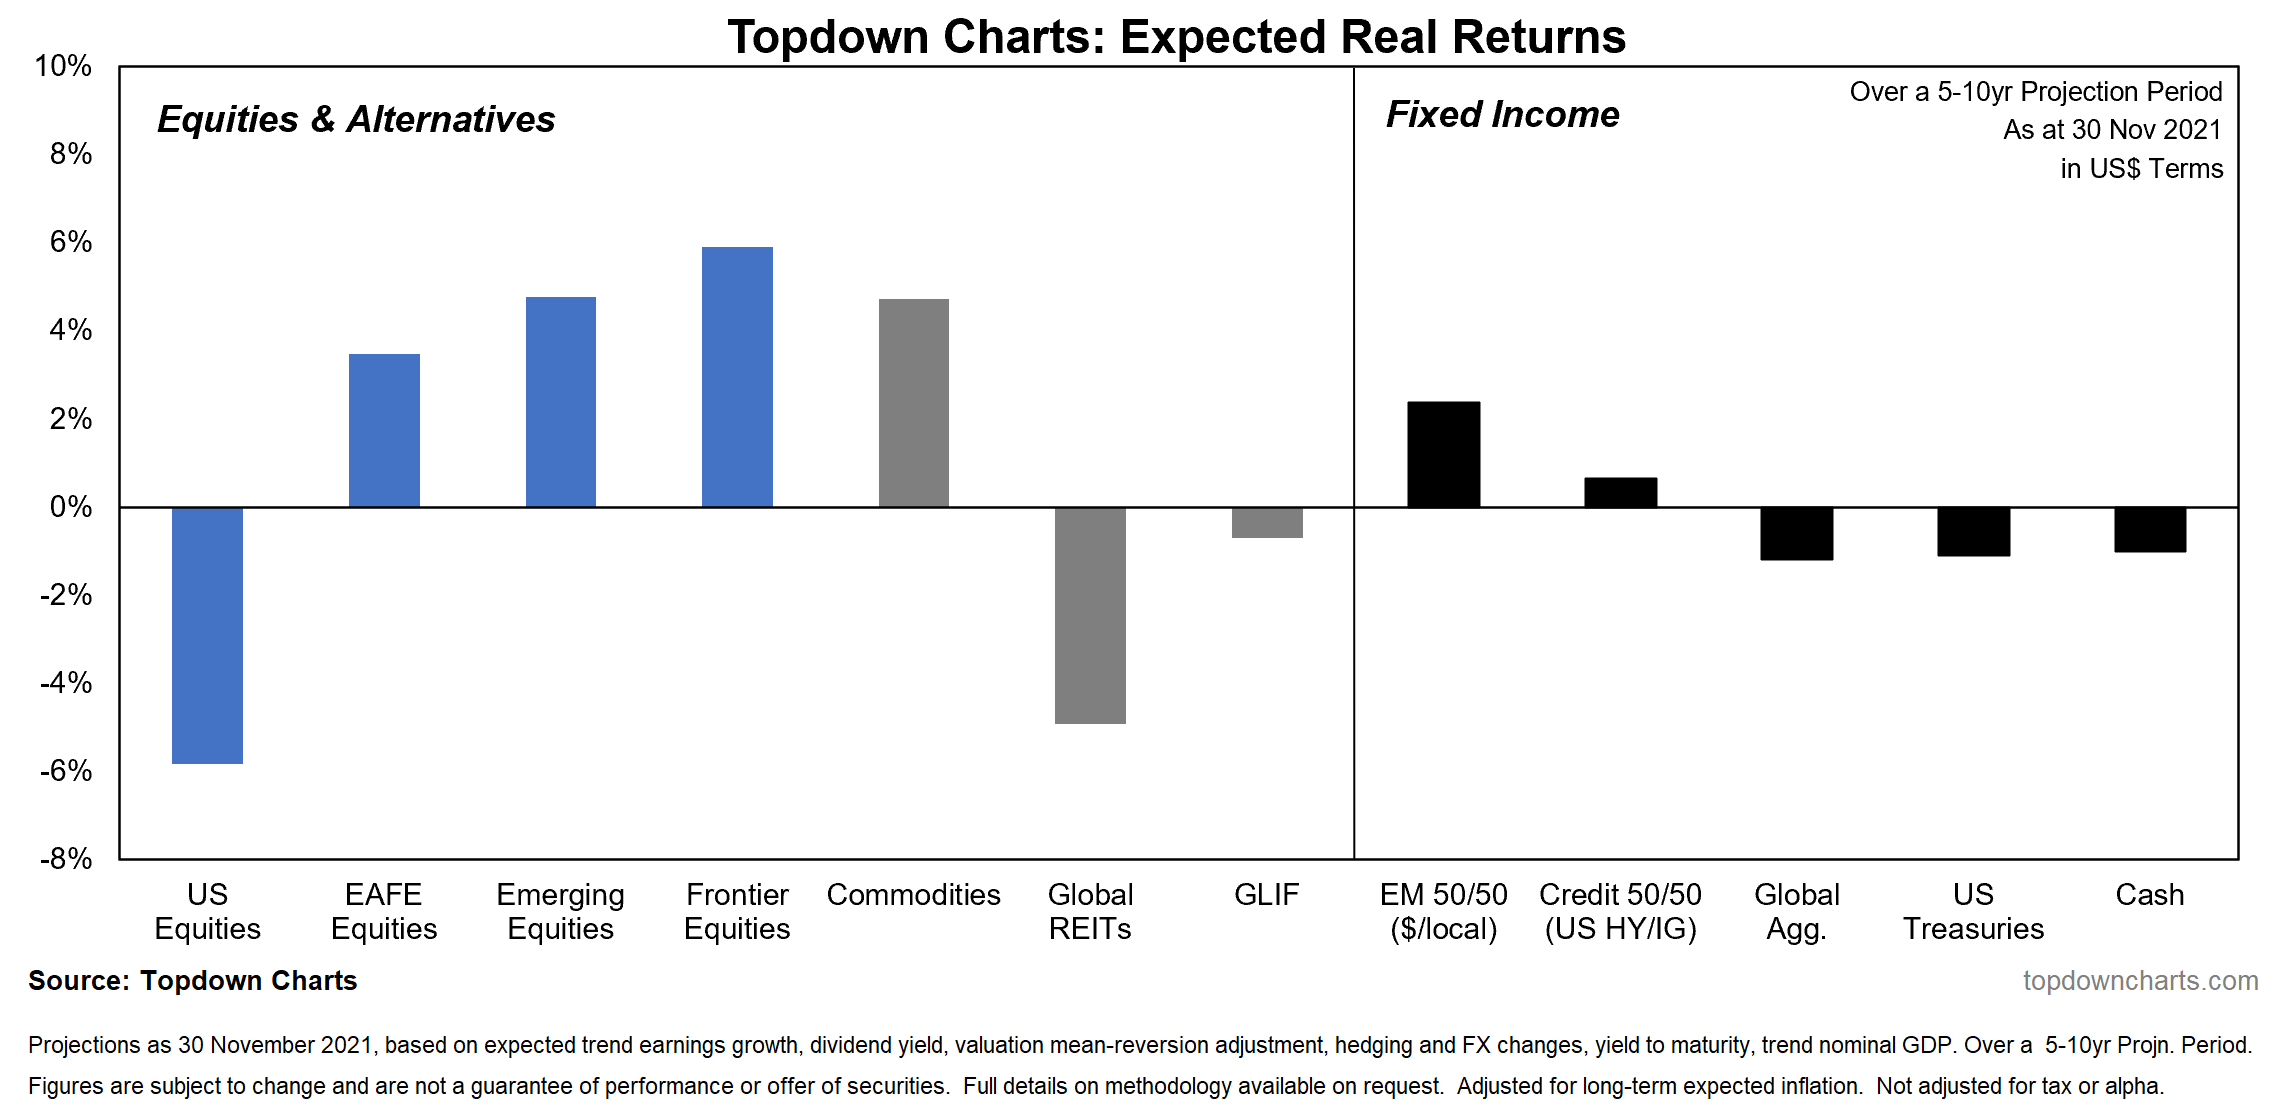
Source: Weekly S&P500 ChartStorm - 5 December 2021 [ Topdown Charts Professional ]
12. The Magazine Cover Indicator: Lastly, while it was a couple of months early, this was a classic example of the magazine cover indicator. The reason this indicator “works” (and p.s. there’s plenty of examples of it not working) is that it’s often only late in the market cycle that the mainstream media tend to really cover and focus on that market (their job is to churn out content, and well, you just pick the obvious zeitgeist issues to zoom in on because that’s what people are interested in and talking about). Overall a reminder to think independently — you don’t have to be a contrarian for contrarian’s sake, but you do need to think.
(also, those with sharp eyes and lateral thinking minds might have also noticed the Afghanistan comment; some would argue the botched withdrawal there emboldened Putin in his decision to invade Ukraine in 2022 (and OSINT observers would have seen that coming) — which was a major catalyst to equity market downside in 2022 by stoking up inflation (surge in commodities) and adverse sentiment effects)
“Magazines like Barron’s and The Economist seem to have an impeccable record of picking tops and bottoms with their covers - so the one below certainly raised some eyebrows this week; particularly for the “unstoppable“ tech sector.”
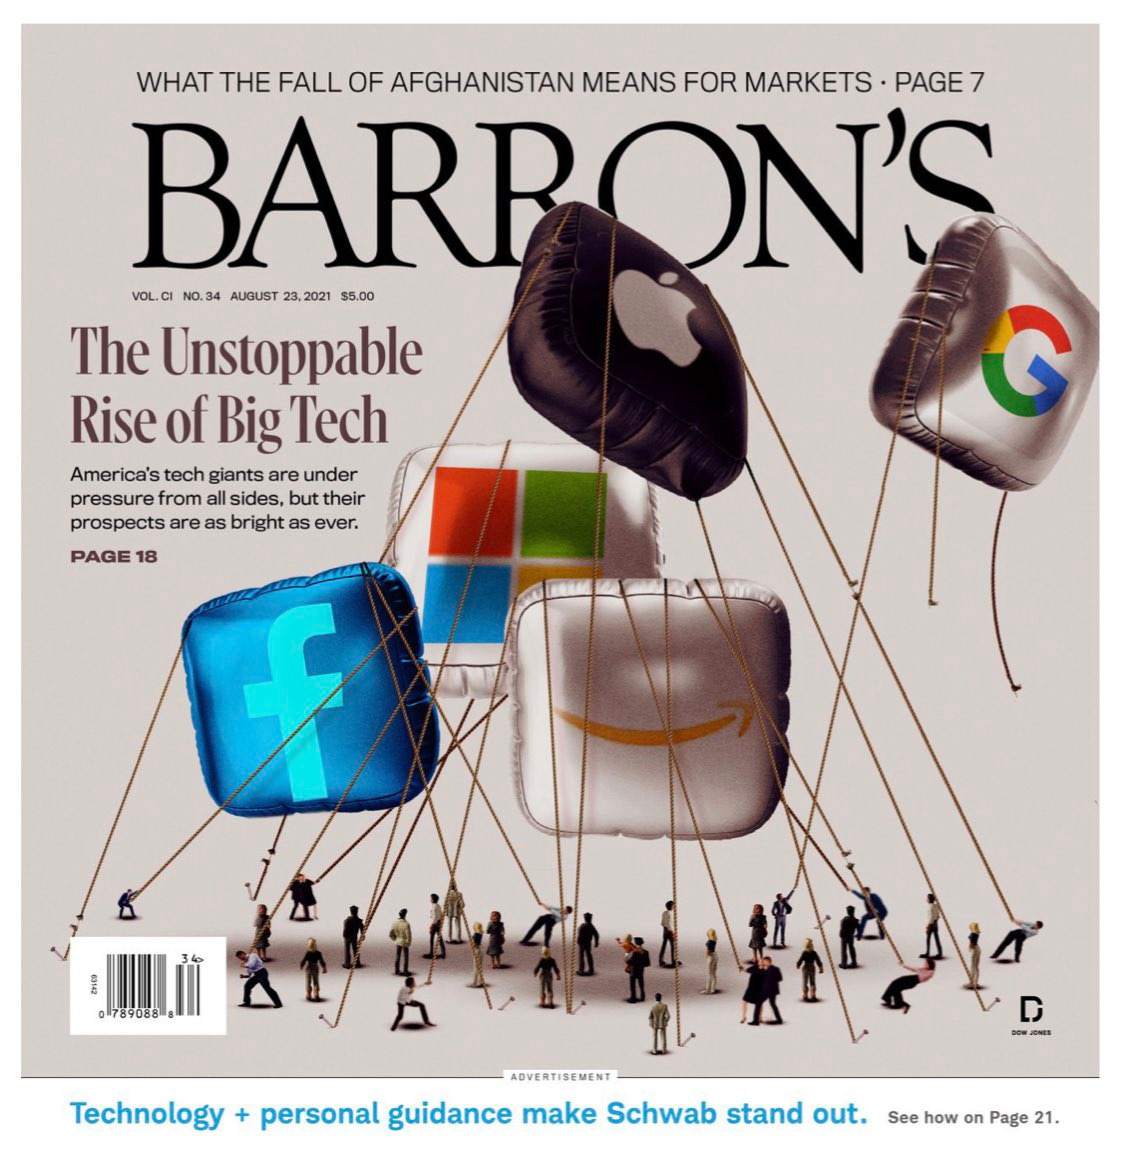
Source: Weekly S&P500 ChartStorm - 29 August 2021 [ @chigrl ]
To wrap-up, it’s clear that there were multiple signs and signals for those who were paying attention (and I’d like to think I helped readers by flagging many of these at the time). It’s useful to reflect on this because it goes to show you don’t need to be a victim of the cycle — rather you can be a victor if you have good information and process.
But also for the principles we can distill: e.g. paying attention to the information in price, staying alert to global developments, keeping an informed eye on sentiment/positioning data, taking note of macro/monetary fundamentals, and being well-informed on valuations and the bigger picture perspective.
And in the end, that’s why I do the Weekly ChartStorm — partly because I just like doing this (I find it interesting; I enjoy the craft), but also because I know I’m helping people with my work.
On that note, if you haven’t subscribed yet, please feel welcome:
also, p.s. I am making this available as a free article, so you can share it or forward on to friends/colleagues if you’d like.
Thanks for reading, I appreciate your support!
—
Best wishes,
Callum Thomas
Founder & Editor of The Weekly ChartStorm
and Head of Research at Topdown Charts
Twitter/X: https://twitter.com/Callum_Thomas
LinkedIn: https://www.linkedin.com/in/callum-thomas-4990063/
NEW: Other services by Topdown Charts
Topdown Charts Professional —[institutional service]
Topdown Charts Entry-Level Service —[entry-level version]
Weekly S&P 500 ChartStorm —[US Equities in focus]
Monthly Gold Market Pack —[Gold charts]
Australian Market Valuation Book —[Aussie markets]
The appeal of E/P-CPI is undeniably strong, but only for the rational. A better indicator than E/P or the real value(=E/P-CPI) is the "yield premium"=E/P-RFR (risk free rate: 2,5,10yr T-note), where the CPI cancels. By design, the CPI underestimates the real inflation (based on same-for-same replacement cost and without other "corrections" applied by the Fed). But even there, when mania sets in (such as 1999-2000, 2008-9, and 2023-5, still does not have much predictive power, and the price often leads it. It can stay at absurd levels (e.g. negative) and mad-crowd still screams for more. Having said that it's hard to resist seeing the updated history of all three: E/P, E/P-CPI and E/P-RFR. The latter currently stands well below 0.5%.
Excellent read, Callum.