Weekly S&P500 ChartStorm - 2 January 2022
This week: a look at annual charts and tables, 2021 in perspective, sentiment, seasonality, big tech, and REITs...
Welcome to the Weekly S&P500 #ChartStorm (by email!)
The Chart Storm is a weekly selection of 10 charts which I hand pick from around the web (+some of my own charts), and then post on Twitter.
The charts focus on the S&P500 (US equities); and the various forces and factors that influence the outlook - with the aim of bringing insight and perspective.
Hope you enjoy!
p.s. if you haven’t already, subscribe (free) to receive the ChartStorm direct to your inbox, so you don’t miss out on any charts (you never know which one could change the whole perspective!)
***ALSO p.p.s.: check out my (Topdown Charts) 2021 End of Year Special Report (includes 50 of my best, worst, and favorite charts of 2021 + the must-see macro/market charts to have on your radar in 2022…)
1. Happy New Year: Annual chart updated for 2021.
28.71% total return last year. Not bad!
Source: @topdowncharts
2. Highs vs Lows: It was a much quieter year in 2021 as measured by the spread between the closing high vs low of the year. Stark contrast to 2020.
Source: @topdowncharts
3. 2021 VIX Annual: The annual average CBOE VIX (Volatility Index) reading was a lot lower in 2021. Basically in line with long-term average.
Continued volatility normalization in 2022?
Source: @topdowncharts
4. Total Return Tables: Here’s the detailed total return stats for the S&P500 and friends. (as an interesting side note: you have to really lengthen the lookback for SMID to outpace Large - this past decade has been a large cap’s market)
Source: @hsilverb
5. 2021 in Perspective: The worst drawdown [**for the index**] barely scratched 5%.
(🤔that's a low bar to beat for 2022!)
Source: @Schuldensuehner
6. "when the market goes up 25%+ for the year" (i.e. as in for instance: 2021)
-it never did better the following year.
--(but) it was positive most of the time (85.7%)
---(and) there were some solid follow-on years (with a median of 13%)
But yeah, no doubt: the bar is set high for 2022.
Source: @RyanDetrick
7. Following the Seasonal Script: Here's a last look at everyone's favorite seasonality chart. Turns out 2021 pretty much stuck to the seasonal script -- made it all seem a bit too simple. Surely 2022 won't be as simple? (but let’s see!)
Source: @topdowncharts
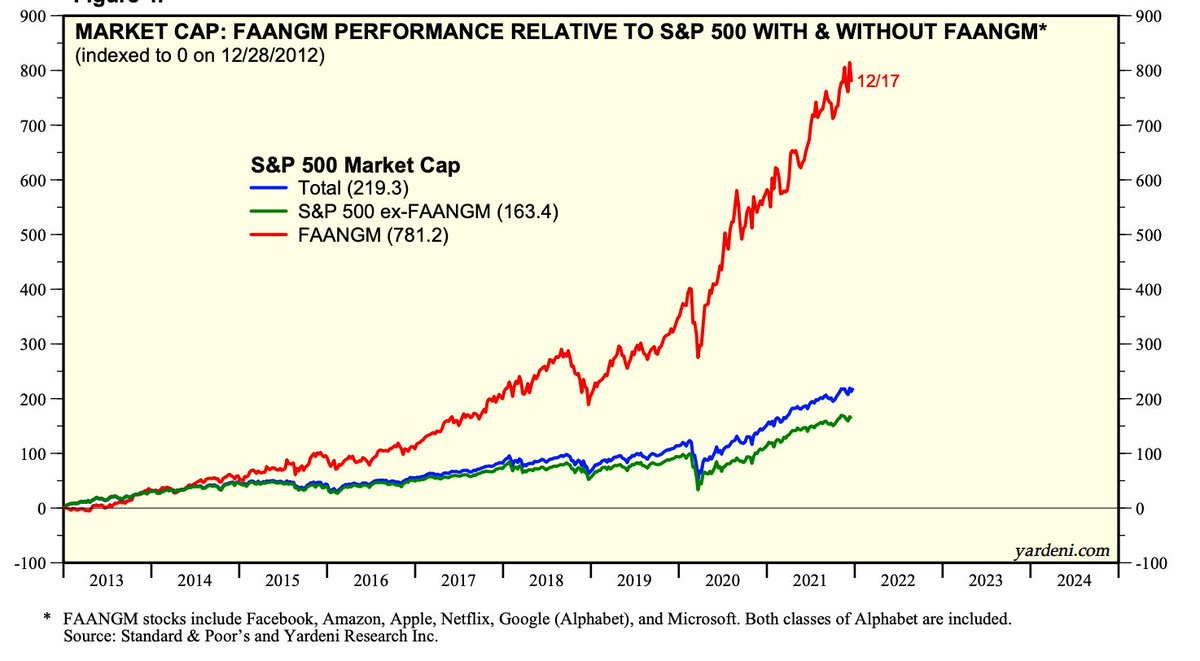
8. The Two Markets: There's the market... and then there's *the market*.
Basically a group of large cap US tech stocks set the pace, and pretty much everything else (global ex-US, EM, small caps, value, etc) lagged behind in the face of a massively high hurdle to beat.
Source: @masterly_in
9. REITs Relative: REITs’ relative performance, really interesting...
REITs were one of the losers of the pandemic: question is can post-pandemic normalization tailwinds outweigh possible headwinds from monetary policy normalization for this typically rate sensitive sector?
Source: @PrattyCharts
10. Bulls vs Bears at the Turn of the Year: Here’s a look at rolling 12-monthly average sentiment readings: 2021 ended with bulls rolling over from multi-year highs, and bears turning up from the lows...
Source: @topdowncharts
Thanks for following, I appreciate your interest!
oh… that’s right, almost forgot!
BONUS CHART >> got to include a goody for the goodies who subscribed.
Fed Policy Direction vs the Market: the monetary policy tides are turning…
This chart shows the annual rate of change in the Fed Funds rate, along with the same for the “shadow fed funds rate“ (which adjusts for the impact of QE). As you can see things have already turned the corner.
With regards to specifics though, the Fed has already begun taper and in December announced accelerated taper and acknowledged the likelihood of higher interest rates in 2022. Clearly things are turning the corner.
This doesn’t mean a bear market or crash is right around the corner as such, but the odds are increasingly against the bulls with every incremental move to reduce/remove monetary stimulus. Particularly as valuations reach extreme expensive levels.
“Priced for perfection“ is all very well and good in the perfect world, but not so much in a less than perfect world…
This will be a key theme to watch as the risk/reward balance shifts in the months and years ahead.
That all said, here’s wishing you a healthy, happy and profitable 2022!!
—
Best regards,
Callum Thomas
SPONSOR: ( …he’s me!)
My research firm, Topdown Charts, has a new entry-level Substack service, which is designed to distill some of the key ideas and themes from the institutional fund manager service to provide the same high quality insights at a more accessible price.
Give it a try and let me know what you think :-)


