Weekly S&P500 ChartStorm - 26 December 2021
This week: technicals check, fun with fund flows, records set in 2021, Christmas chart
Welcome to the Weekly S&P500 #ChartStorm (by email!)
The Chart Storm is a weekly selection of 10 charts which I hand pick from around the web (+some of my own charts), and then post on Twitter.
The charts focus on the S&P500 (US equities); and the various forces and factors that influence the outlook - with the aim of bringing insight and perspective.
Hope you enjoy!
p.s. if you haven’t already, subscribe (free) to receive the ChartStorm direct to your inbox, so you don’t miss out on any charts (you never know which one could change the whole perspective!)
>>> ALSO: in case you missed it, I published my 2021 End of Year Special Report last week — click through for the download link for a free look.
1. Breakout? Pretty light volumes, but the S&P500 managed a new all-time *closing* high last week, and an initial breakout through that key overhead resistance level... But it left me asking: will the breakout stick? (or will it be more of the same range-trading of the past 2-months now).
Source: @Callum_Thomas
2. Stealth Correction: Still the "Stealth Correction" continues — around a 3rd of the market is tracking below their respective 200-day moving averages. It’s that ongoing theme of narrow leadership, and winners vs losers.
Source: @Callum_Thomas
3. Global Equity Breadth: Similar thing at the global level -- a quarter of countries (main benchmarks) are trading below their respective 200-day moving averages, and global equities ex-US peaked months ago...
Source: @topdowncharts
4. Fund-Flow Seasonality: With all this talk of stealth corrections (maybe the weak breadth could be interpreted as some of the steam being safely vented from the market!) — and the initial breakout in the S&P500 (and so far relative stability in global equities vs outright declines, especially with that support level holding)… maybe it will be back to the races for markets in January if this usual seasonal pattern in fund flows charted below holds.
Source: @ISABELNET_SA
5. Fund-Flows or Fun-Flows? Global inflows into equities topped $1tn the past year as investors scramble to chase the latest speculative flavor of the month.
Source: @Schuldensuehner
6. Fun With Fund Flows: From "Sell Everything" to "Buy Everything" ...and now? ("Buy Some of the Things?)
This chart tracks the rolling 3-month flows into all stock and bond funds in the US - pretty interesting path it’s taken. Does seem to be …tapering… -off somewhat recently though.
Source: @topdowncharts
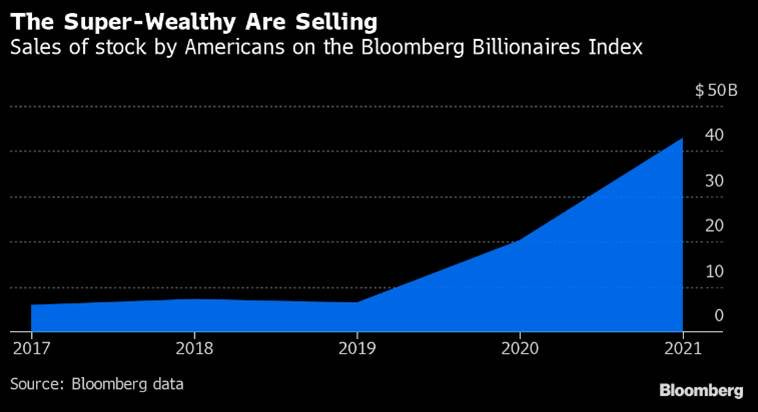
7. Billionaire Bye-Bye: According to Bloomberg, US billionaires sold over $40 billion in stock this year (vs $20B in 2020). Market movements obviously helped some, and obviously Elon selling down Tesla (following his Twitter poll to ask if he should) skews the number a little bit. But again, can’t blame them for taking some gains off the table after such a strong run (and arguably a gradually shifting risk vs return outlook).
Source: @LizAnnSonders
8. All-Time Highs: Not quite a new ATH in ATH's but pretty close to it -- the year 2021 is in second place at an updated 68 new All-Time-Highs.
Source: @drtimedwards
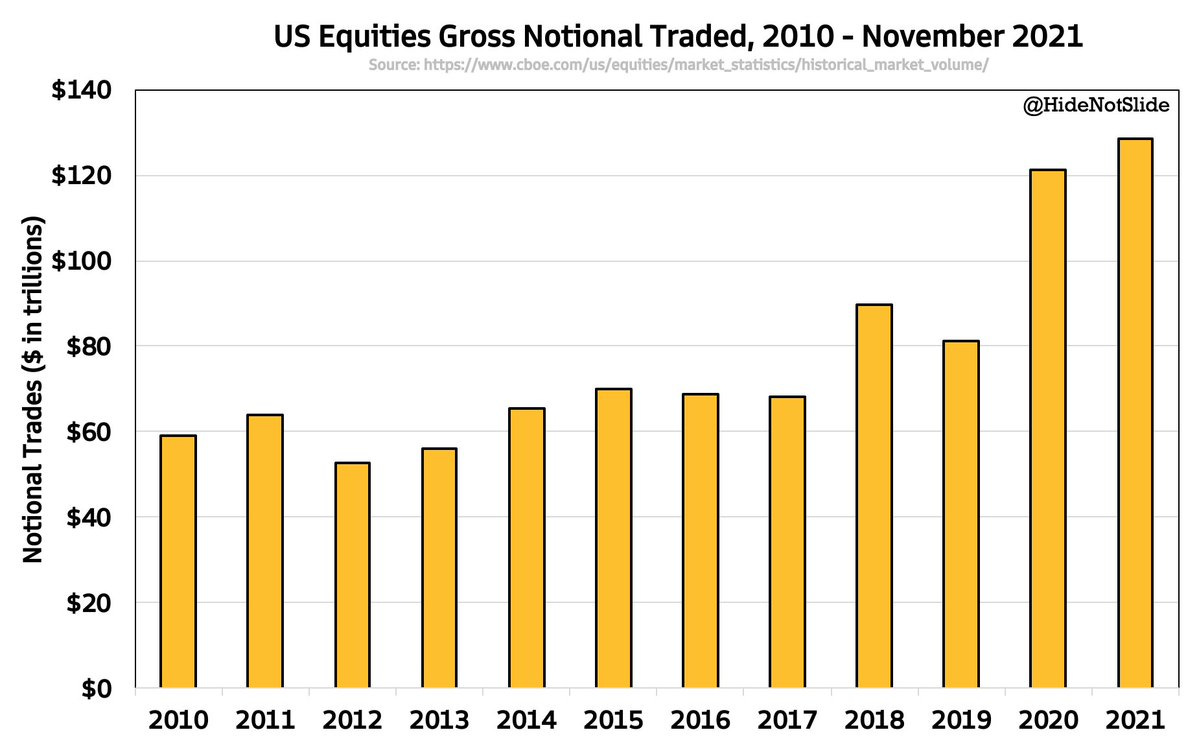
9. Trading Up: Record high $130 TRILLION total gross notional value traded in US equities this year (and that's ex-Dec data!).
Source: @HideNotSlide
10. Oh Christmas Chart: Last one this week has to be the "Christmas Tree Chart" of annual SPX returns distribution. Still a few trading days left this year, but solid result for the index in 2021.
Source: @CarterBWorth
Thanks for following, I appreciate your interest!
oh… that’s right, almost forgot!
BONUS CHART >> got to include a goody for the goodies who subscribed.
Sentiment Check: Bullishness down, Bearishness up.
This pair of charts tracks the monthly average combined readings from the AAII and II surveys, and there has been quite the shift in recent months.
As the market kind of hit the wall and went into range-trading mode, not to mention the wall of worry (omicron, Fed taper/tightening, fiscal uncertainty, geopolitics, etc), bullishness has come down substantially from previous frothy levels, and bearishness has stirred from previous slumber.
It leaves us with an open question: is this the sign of a turning point? or is this a healthy stealthy correction in previously overheated sentiment?
Certainly gels with the first 4 charts of this session, and certainly something to ponder between holiday season festivities.
On that note, Happy Holidays!
—
Best regards,
Callum Thomas
SPONSOR: ( …he’s me!)
My research firm, Topdown Charts, has a new entry-level Substack service, which is designed to distill some of the key ideas and themes from the institutional fund manager service to provide the same high quality insights at a more accessible price.
Give it a try and let me know what you think


