As previously noted (see the original post for FAQ), I am going to be running my regular weekly surveys here on Substack — see results from the initial test run (+ data/charts back to 2016).
Please cast your votes below…
(feel free to add any thoughts/color/questions in the comments section)
Equities Survey (for practical purposes assume this is S&P500)
Bonds Survey (for practical purposes assume this is US ~10-yr Treasuries)
For more details on the surveys, please see the FAQ (including the comment section Q&A). The main thing is to just select the answer which best fits your primary/strongest view and most relevant timeframe.
Other than that, you are welcome to add any further thoughts in the comment section.
+TOPICAL SURVEY… It’s FOMC week — so what do you reckon?
Thanks for taking part! :-)
Timeless Charts — as a thank you, here’s another couple of charts to ponder…
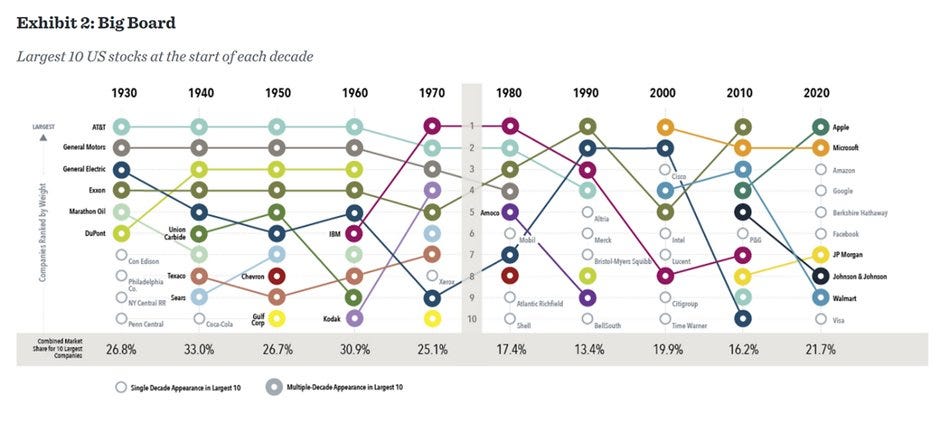
The Ten Biggest Stocks Through Time:
Huge changes over the years
Many came and went
Few stayed on top
Makes you wonder what will 2030's group look like?
(source: Weekly ChartStorm 6-July-2020)
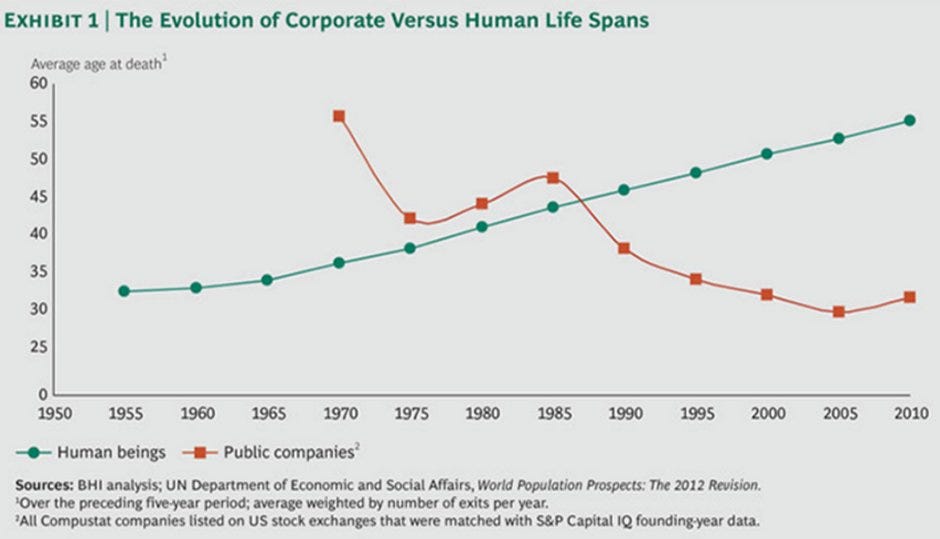
Human vs Corporate lifespans — an oldie but a goodie
People are living longer
Companies dying younger
Bullish humanity, bullish innovation…
(source: Weekly ChartStorm 25-Sep-2016)
—
Thanks and best regards,
Callum Thomas
Founder & Editor of The Weekly ChartStorm
Twitter: https://twitter.com/Callum_Thomas
LinkedIn: https://www.linkedin.com/in/callum-thomas-4990063/


Speaking of Fed, there's also CPI data out... albeit some might argue that CPI is less important now vs labor market data (the Fed is looking for an excuse to cut, and the excuse to cut will only come from weaker labor data + no major resurge in inflation)