

Following this week’s successful trial run of conducting the weekly market sentiment surveys here on Substack (n.b. I have been running the surveys on Twitter since 2016), here’s the results + data.
NOTE: I will be running the surveys here on Substack ongoing, please subscribe to participate (access will be open for both free and paid subscribers).
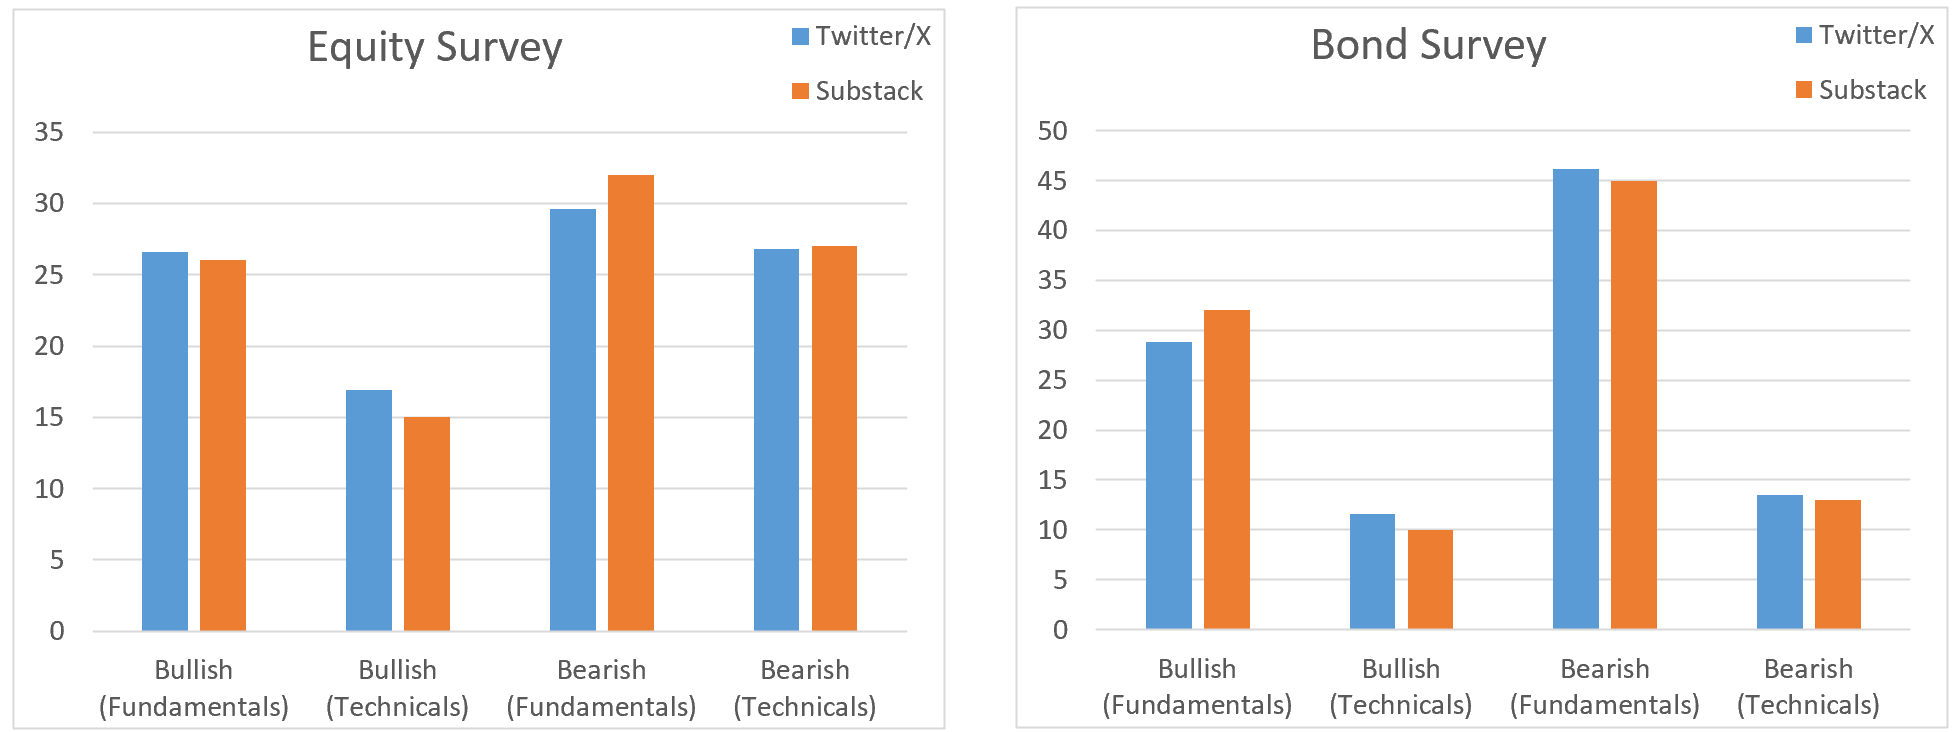
First of all, I wanted to share how Twitter vs Substack compared in the responses. As you can see, it’s more or less identical (and this maps to my experience that once you get over a certain number of responses, the results don’t change much, and for reference I got more responses on Substack vs Twitter/X).
Second, here’s the data file — please link to or reference The Weekly ChartStorm (www.chartstorm.info) if you use the data to make charts etc.
And Third, here’s some charts that I keep track of, which are likely of interest. Questions and thoughts are welcome in the comments section.
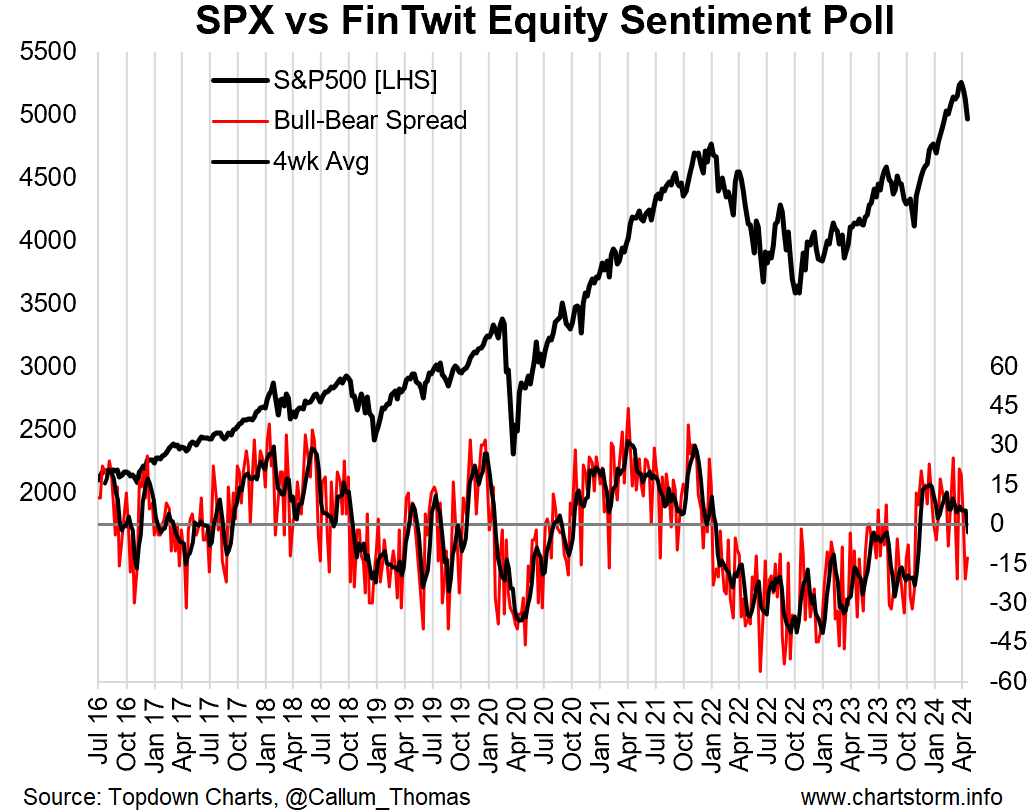
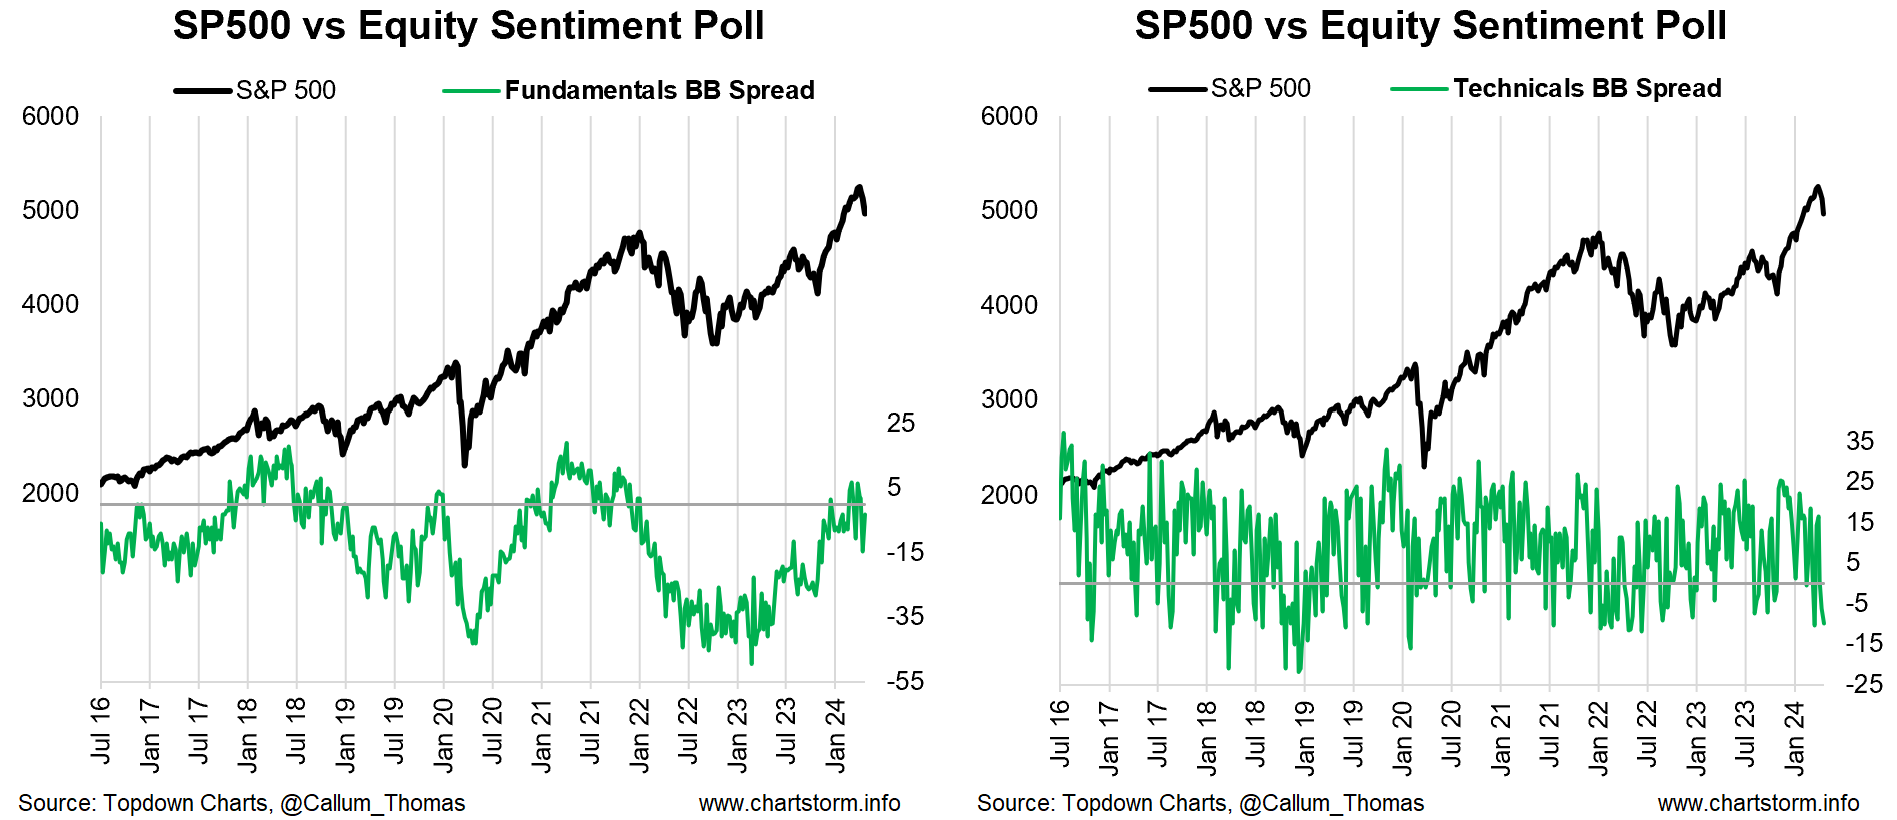
Equity Survey
Overall Bulls vs Bears (total bulls minus total bears)
Bulls vs Bears for “Fundamentals” and “Technicals”
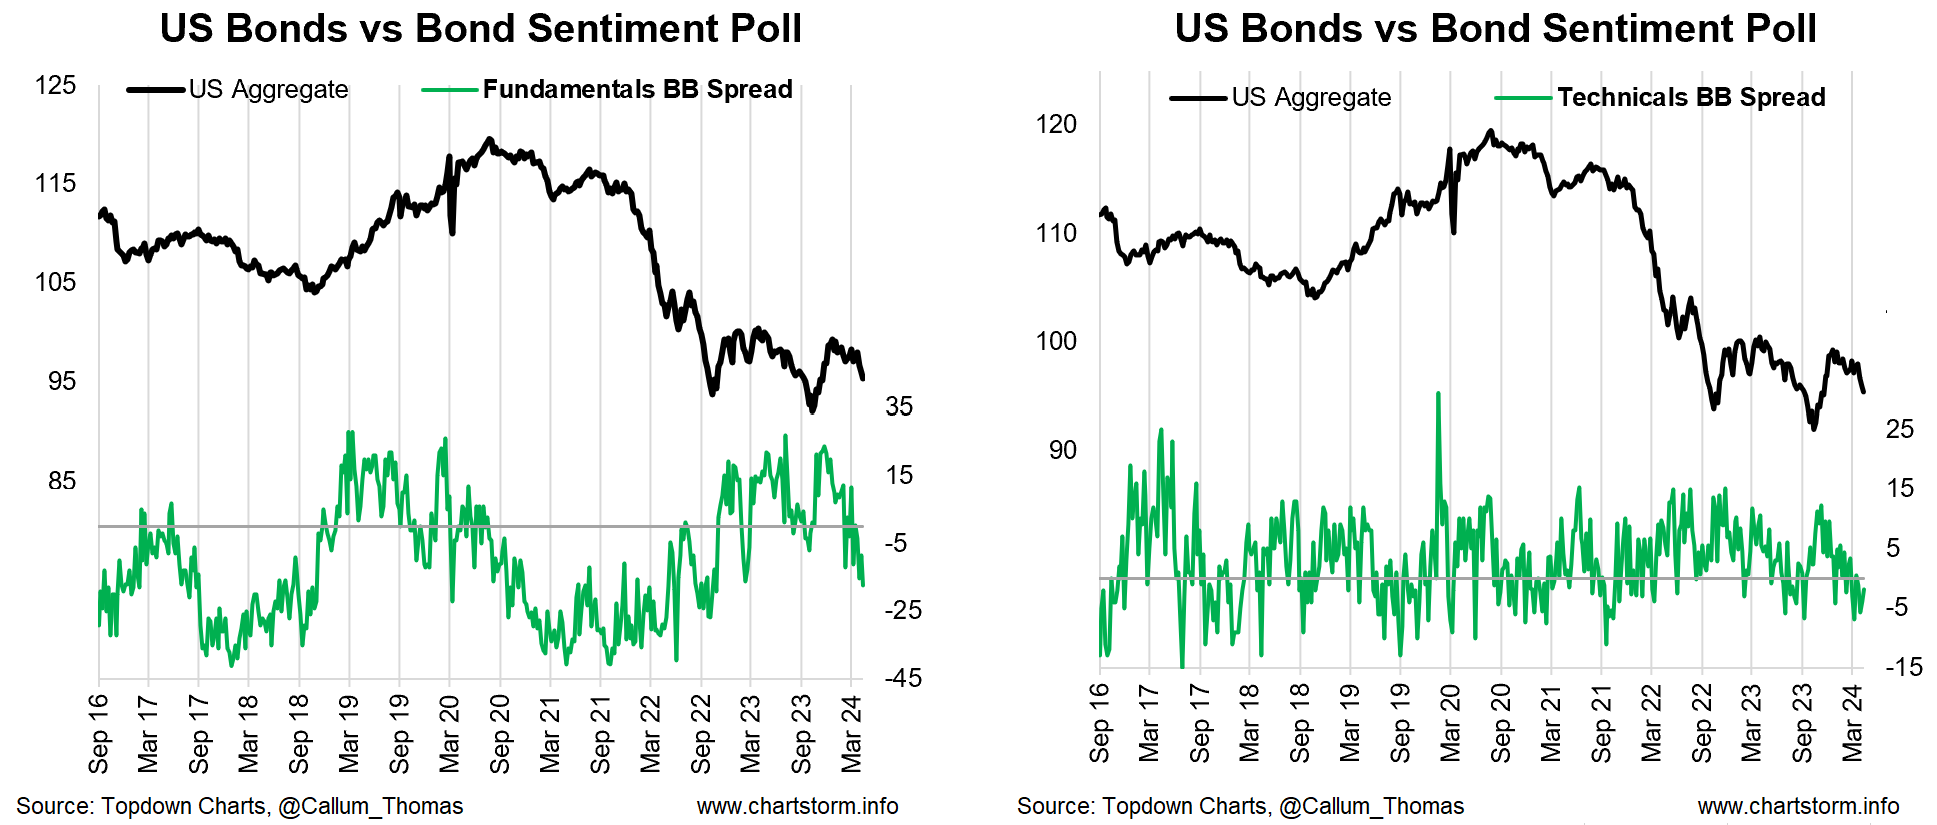
Bond Survey
Overall Bulls vs Bears (total bulls minus total bears)

Bulls vs Bears for “Fundamentals” and “Technicals”
Equity + Bond Survey — Combined View
Interestingly, enough if you combine the “Fundamentals” score from both surveys, you get a macro/fundamental gauge, and it maps fairly well to the global PMI.

Thanks for your interest, and again, please subscribe and participate in the Weekly Surveys ongoing :-)
—
Thanks and best regards,
Callum Thomas
Founder & Editor of The Weekly ChartStorm
Twitter: https://twitter.com/Callum_Thomas
LinkedIn: https://www.linkedin.com/in/callum-thomas-4990063/