As previously noted (see the original post for FAQ), I am going to be running my regular weekly surveys here on Substack — see results from the initial test run (+ data/charts back to 2016).
Please cast your votes below…
(feel free to add any thoughts/color/questions in the comments section)
Equities Survey (for practical purposes assume this is S&P500)
Bonds Survey (for practical purposes assume this is US ~10-yr Treasuries)
For more details on the surveys, please see the FAQ (including the comment section Q&A). The main thing is to just select the answer which best fits your primary/strongest view and most relevant timeframe.
Other than that, you are welcome to add any further thoughts in the comment section.
Thanks for taking part! :-)
Timeless Charts — as a thank you, here’s another couple of charts to ponder…
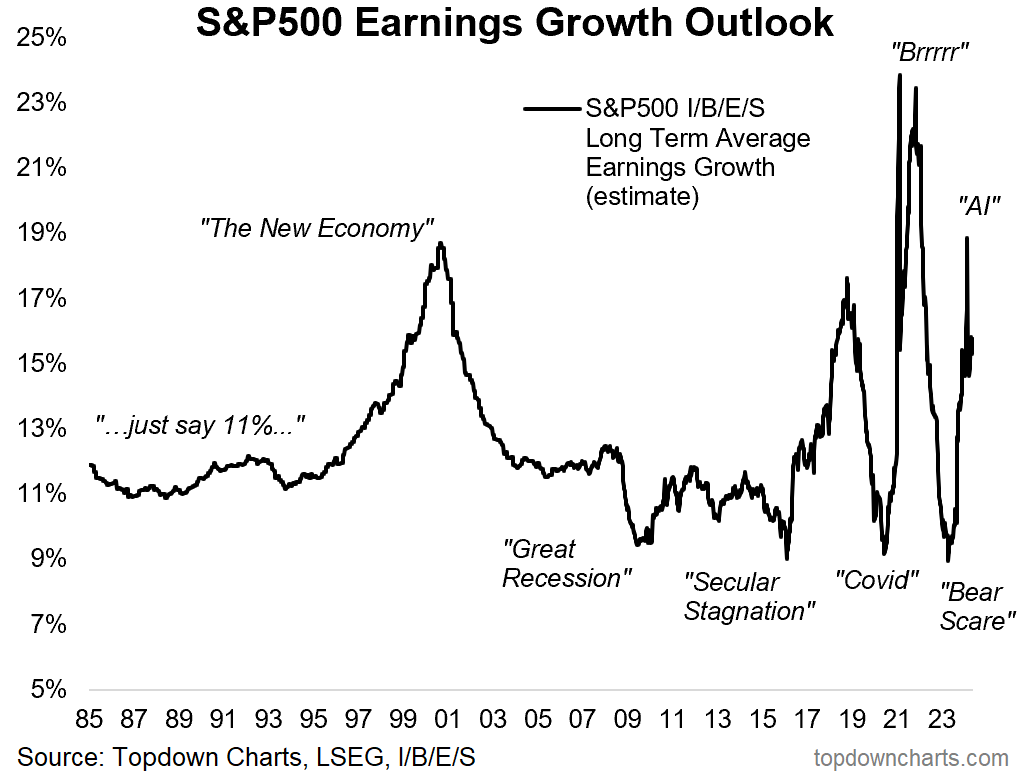
What to Expect when you are Expecting High Growth: I often find Fundamental indicators like the PE ratio function more like Sentiment Indicators, and here's a key example.
The more bullish Wall Street analysts are on Earnings Growth, the weaker subsequent stockmarket returns are likely to be:
1. it's in the price
2. it's a sentiment signal
(source: Weekly ChartStorm 3-March-2024)
And were do things sit now?
Naturally — I wouldn’t say we are doomed (I don’t like hyperbole and sensationalism), but certainly the probabilities are less favorable than usual at these levels…
(source: Topdown Charts )
—
Thanks and best regards,
Callum Thomas
Founder & Editor of The Weekly ChartStorm
Twitter: https://twitter.com/Callum_Thomas
LinkedIn: https://www.linkedin.com/in/callum-thomas-4990063/


not enough choices - shud have mildly bullish and mildly bearish
extremely weak volume means upside limited
Interesting chart.