
Weekly S&P500 ChartStorm - 4 May 2025
This week: monthly chart, technical check, seasonality stats, sentiment, late-cycle resets, foreign (out)flows, volatility records, Warren Buffett, bond market season...

Welcome to the latest Weekly S&P500 #ChartStorm!
Learnings and conclusions from this week’s charts:
The S&P500 closed April down just -0.76% (and -5.3% YTD).
The index cleared 2 key bullish milestones late last week.
Yet bears still hold hope for a failure at the 200dma or 5800.
Seasonality is set to sour (see “sell in May” stats).
One bull case is that we just had a late-cycle reset (like 1998).
Overall, it’s fascinating to reflect on how sharp things rebounded; if you hadn’t looked a day at markets in April you might wonder what all the fuss was about. But with initial bullish milestones passed, the next pinch-point is coming into focus. With bears about to give up, lingering policy uncertainty, and a prospective macro eye-of-the-storm moment, May will be very interesting for macro and markets, and probably sets the tone for the remainder of the year…
VIDEO/PODCAST: click through for a ChartStorm focused session on The Contrarian Capitalist Podcast from last week.
Also, ICYMI: check out the new “Getting Started” section (how to make the most of your subscription to the Weekly ChartStorm) + Reviews & Testimonials page.
1. Happy New Month! After at one point falling more than 10% during April, the S&P 500 index finished the month down just -0.76% (and -5.3% YTD). Zooming out to the monthly closing chart it looks a little more benign than it did earlier in April, but it doesn’t look entirely confidence inspiring either.

Source: Topdown Charts
2. Technical Check: Back on the daily chart however we have a couple of bullish milestones; the index is back above 5600 and back above the 50-day moving average (and 50dma breadth has surged from oversold levels). For bears the only hope now from a short-term technicals standpoint is that the rebound fails at the 200-day moving average and overhead resistance ~5700 (and more significantly at 5800).

Source: MarketCharts
3. Seasonality Below the 200dma: While at this point the S&P500 index is only 1% away from reclaiming its 200-day moving average, here’s a glance at how the index is tracking vs the seasonal trend when the index was below its 200dma. There is a tendency for seasonal strength/stability around this time, only to be followed by renewed weakness in May/June. Will it be different this time? Will the market find a convenient reason to invoke this seasonal weakness? (…or will the index just pop back above the 200-day average and make this chart irrelevant?)

Source: Chart of the Week - Seasonality Below
4. Market Seasons: It’s about now that you start seeing people wheel out the “Sell in May” charts… some of them only focus on the month, and that’s wrong; the original saying states that you sell in may, go away, and come back on St Ledger’s day (~Oct/Nov). And the stats show historically the Nov-Apr period is generally much better in terms of percentage positive and average return than the May-Oct period — and the May-Oct period is particularly poor during bear markets.

Source: Off-Topic ChartStorm — Seasonality Deep Dive
5. On Partial Resets: I think at this point, unless this really is just an eye of the storm moment and we’re in a bear market rally, the main bull case or prognosis is that we just went through a late-cycle reset. That assessment would probably be the only way you look at a chart like this one and come away bullish (vs concluding that the cycle has peaked and is rolling over and that the bear is only just getting started and the biggest and best buying opportunities are still to come).
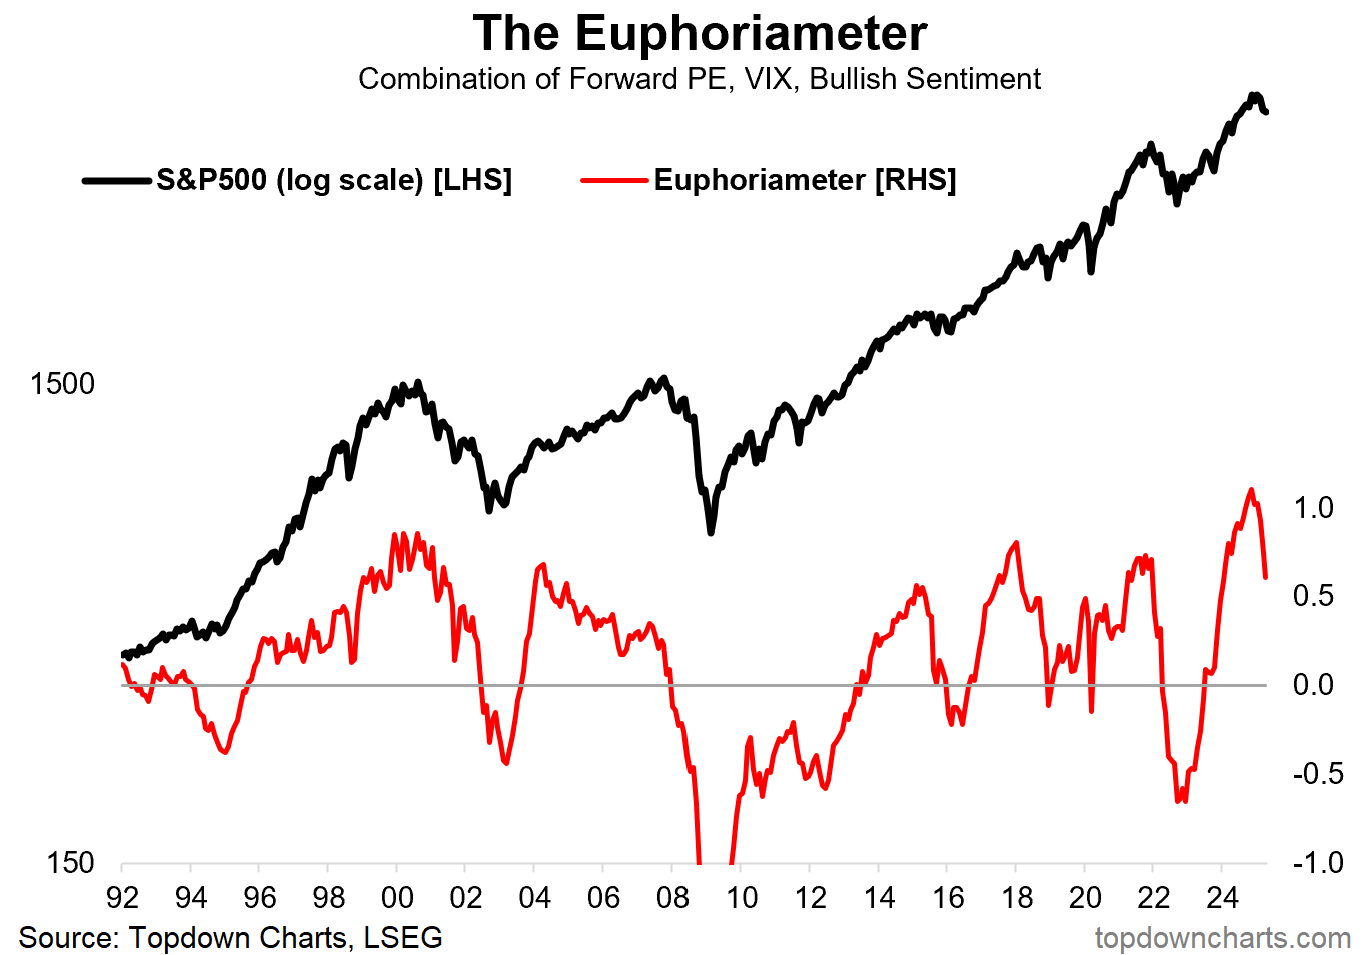
Source: The Euphoriameter (explained)
6. Partial Reset Analog: Keeping with the idea of a partial reset, the best analog of that idea would be the late-90’s reset in stocks, which preceded the ultimate peak of the dot com bubble by almost 2 years. Not a prediction, but a point to ponder.
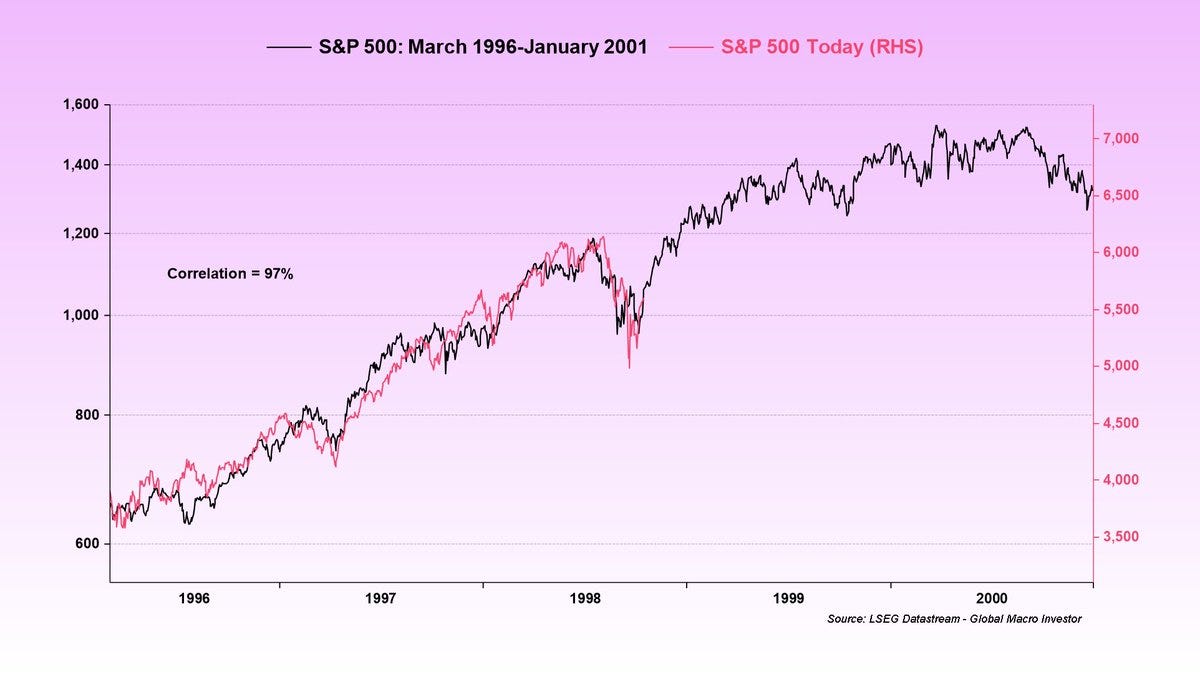
Source: @BittelJulien
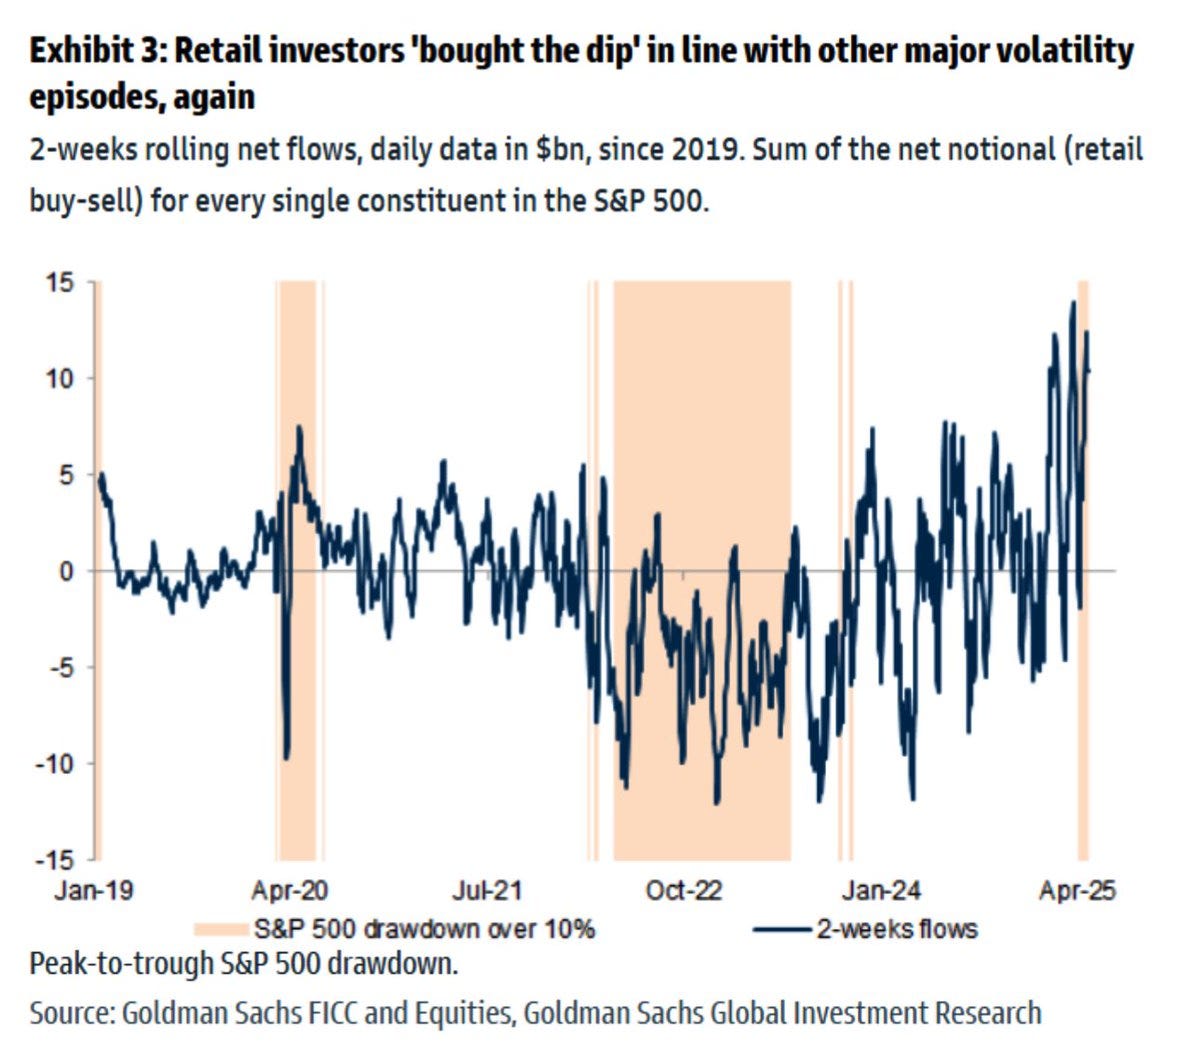
7. Retail Behavior: I mentioned something similar last week, but I wanted to share this chart because of the contrast between the 2022 bear market vs now. Based on flows, confidence is still very high; with net-buying being the rule (and net-selling the exception) — it was the opposite back then.
This kind of tells you that the psychology inherent at the moment is still stubbornly bullish among retail (despite, or even because of, the very bearish survey data on investor mood).
Source: @WallStJesus
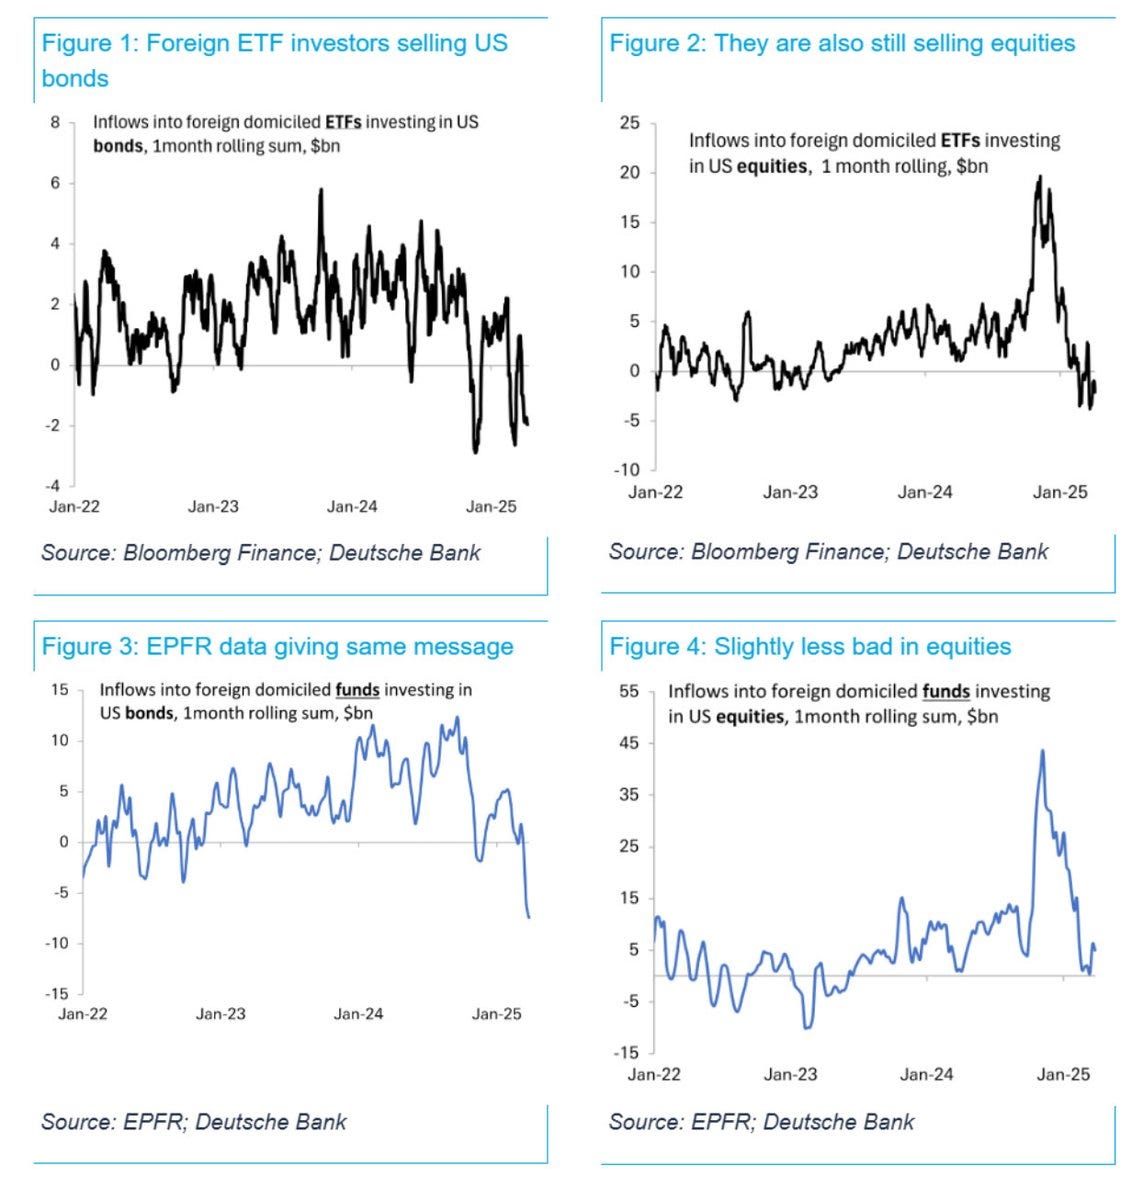
8. Foreign Flows: With the US dollar heading into bear market and political risk weighing heavily, foreigners have had a clear change in heart on US assets with net outflows from US bond funds, and a sharp drop in demand for US stocks. As I’ve previously mentioned, this can become self-reinforcing.
Source: @lisaabramowicz1
9. History Books: Here’s one for the history books — the amount of volatility we saw in early April was eclipsed only by the 1987 crash and 2008/09 financial crisis.
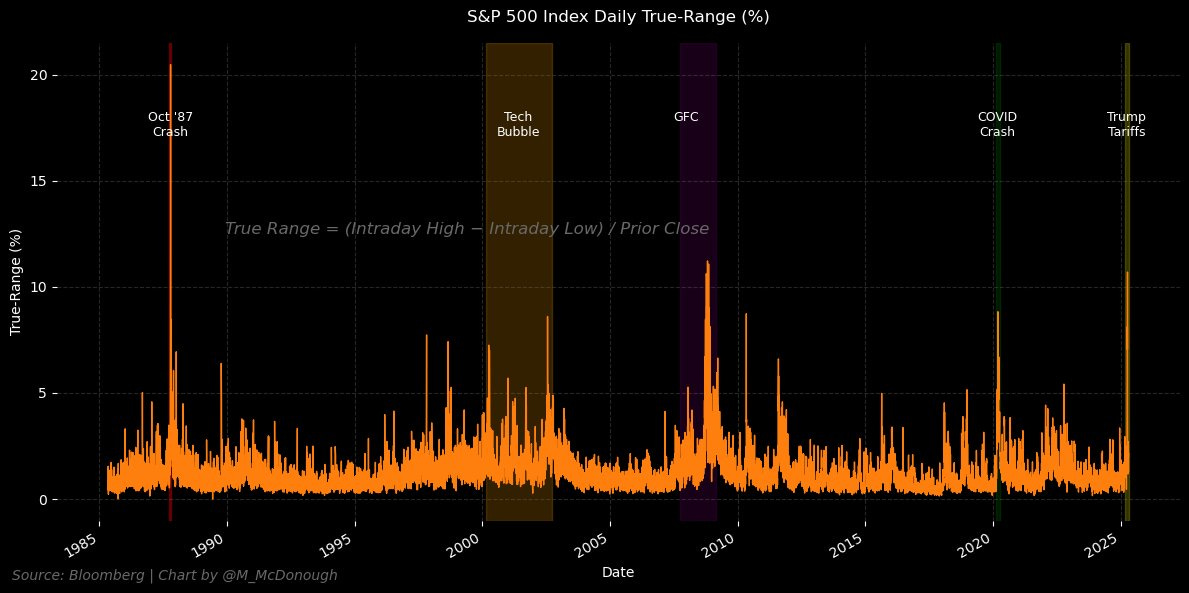
Source: @M_McDonough
10. Warren Buffett: With the legend announcing his retirement this weekend, it’s only appropriate to repost this classic chart — which I always find profound just from the standpoint that he only made his first $1B in his 50’s (and crossing 10B in his 60’s)... which goes to show the power of compounding, and how you’re never too late in life to achieve big things.
And hey, another point to ponder is timing — will we look back on his retirement as a marker of a major market peak? (not to mention the quip that he probably won’t get to be the one to deploy the record high cash war chest that Berkshire has raised!)
Anyway, truly one of the greatest of all time, and really a great educator + inspiration.

Source: Weekly S&P500 ChartStorm - Timeless Classics
Thanks for reading, I appreciate your support! Please feel welcome to share this with friends and colleagues — referrals are most welcome :-)
BONUS CHART/THEME SECTION
Bond Market Seasonality: with the negative Q1 GDP print of last week and soft CPI reports, the prospect of a disinflationary recession is being raised. One school of thought is tariffs will drive inflation higher, the other school of thought is that tariffs will drive costs higher and squeeze profit margins and discretionary incomes — and end up being deflationary to demand…
The possibility of a disinflationary recession would certainly be bond bullish — and as it so happens, we’re just getting into the part of the year which has historically been good for bonds (bonds have had a historical tendency for seasonal strength from May through to October).
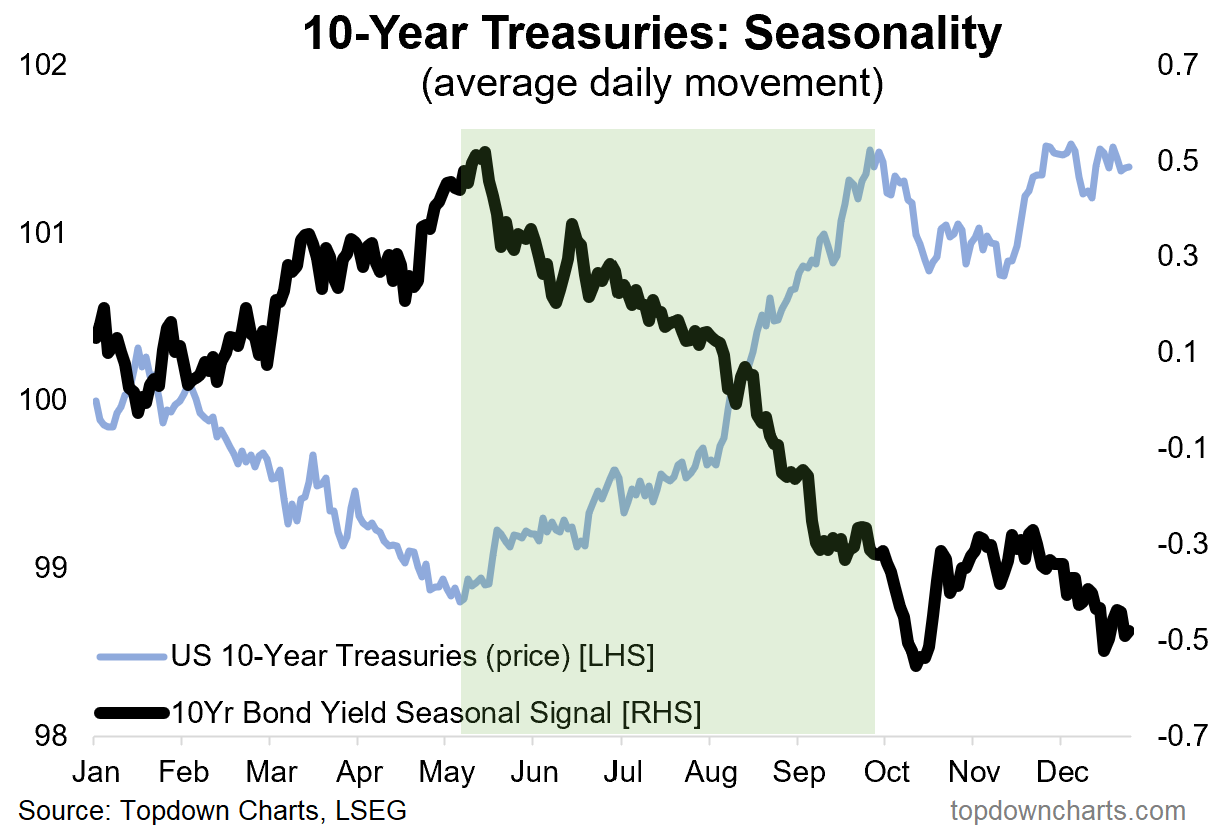
So just as the seasons are turning bad for stocks, it may now be the season for bonds.
Definitely food for thought for portfolio construction.
—
Best wishes,
Callum Thomas
Founder & Editor of The Weekly ChartStorm
and Head of Research at Topdown Charts
Twitter/X: https://twitter.com/Callum_Thomas
LinkedIn: https://www.linkedin.com/in/callum-thomas-4990063/
NEW: Other services by Topdown Charts
Topdown Charts Entry-Level — [TD entry-level service]
Topdown Charts Professional — [institutional service]
Monthly Gold Market Pack — [Gold charts]
Australian Market Valuation Book —[Aussie markets]
Thoughtful charts as always Callum. What's puzzling for me is if there's been an outflow of funds from international investors How can the S&P 500 start to look more bullish? It seems to me that reduced funds would reduce demand and would cause a decrease in price. Is there something basic here that i'm missing?
Very good charts. I would like to add the "ratio Mag 7 / SP 500", which reached ATH in Feb.'25, then dropped and now knocking again to that ATH, which says "58% share of Mag7 of total SP500 performance" (simplified said). From my understanding the recent SP500 strength is also again very much about Mag7 and the question is, can they further drive the market up? In the link below a TradingView-chart, which I have created: it shows the ratio "Mag7/SP500", the SMA200-weekly (blue and dotted extension) and some key levels. If the ratio breaks SMA200-daily (red), the channel bottom trend-line (black) and then would drop to the SMA200-weekly, I would monitor, how it behaves (like Apr22 or going up again? ...plus surrounding Market analysis). I still "believe" that some lower levels in the market will be tested, may be not the lowest 07Apr we have seen, but close or proximity to that. Alternatively: it breaks the ATH Feb25 and moves up (with or without retest)... Link: https://www.tradingview.com/x/6y7WlgsK/