
Weekly S&P500 ChartStorm - 20 July 2025
This week: latest developments in semiconductor stocks and a brief study of stockmarket history (lessons on sectors and cycles...)

Welcome to the latest Weekly S&P500 #ChartStorm!
Learnings and conclusions from this week’s charts:
Semiconductors made further new highs last week.
The market cap weight of semis also reached a record high.
History tells us this is normal/healthy, but needs to be monitored.
Market cap skews + stretched valuations = stocks are late in the cycle.
Market booms start with good reason and end when things get unreasonable.
Overall, it’s a good opportunity to take a minute out to reflect on some of the big shifts that have occurred in markets, particularly as it relates to the risk and cycles outlook. Learning from history means learning to identify risks and opportunities, and keeping grounded in data as well as understanding what may come next…
n.b.: check out the “Getting Started” section (how to make the most of your subscription to the Weekly ChartStorm), and Reviews & Testimonials page.
1. Semiconductors ATH: Semiconductors remain one of the biggest stories in today’s market, and with the breakout to new all-time highs it raises a few questions and issues to think about not just with regards to semis but the stockmarket as a whole.
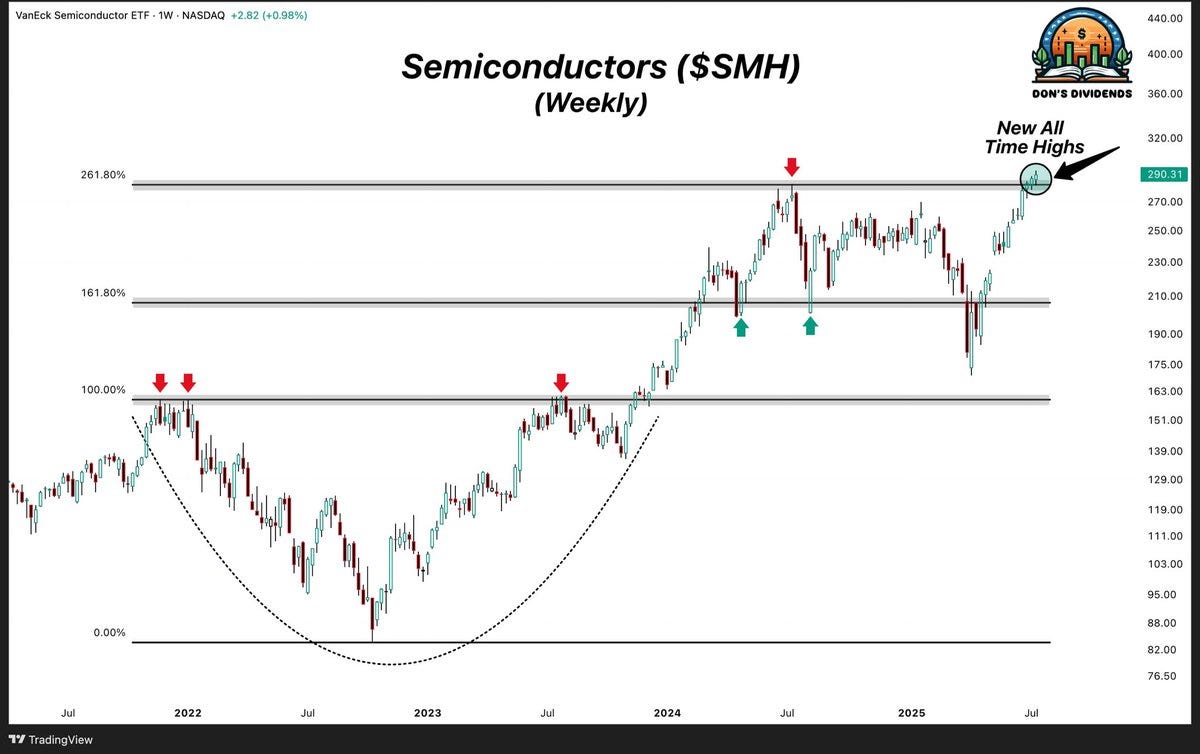
Source: @TheDonInvesting
2. The Rise & Rise of Semiconductors: One key consequence of the surge in semis is the breakout to new all-time high market cap weightings. Bears will be getting nervous at the sight of this chart, and bulls will tell us that’s actually a bullish technical pattern (a bull flag). But what does it really tell us when you see a chart like this turning up? Let’s browse a few historical examples and see what we can learn…
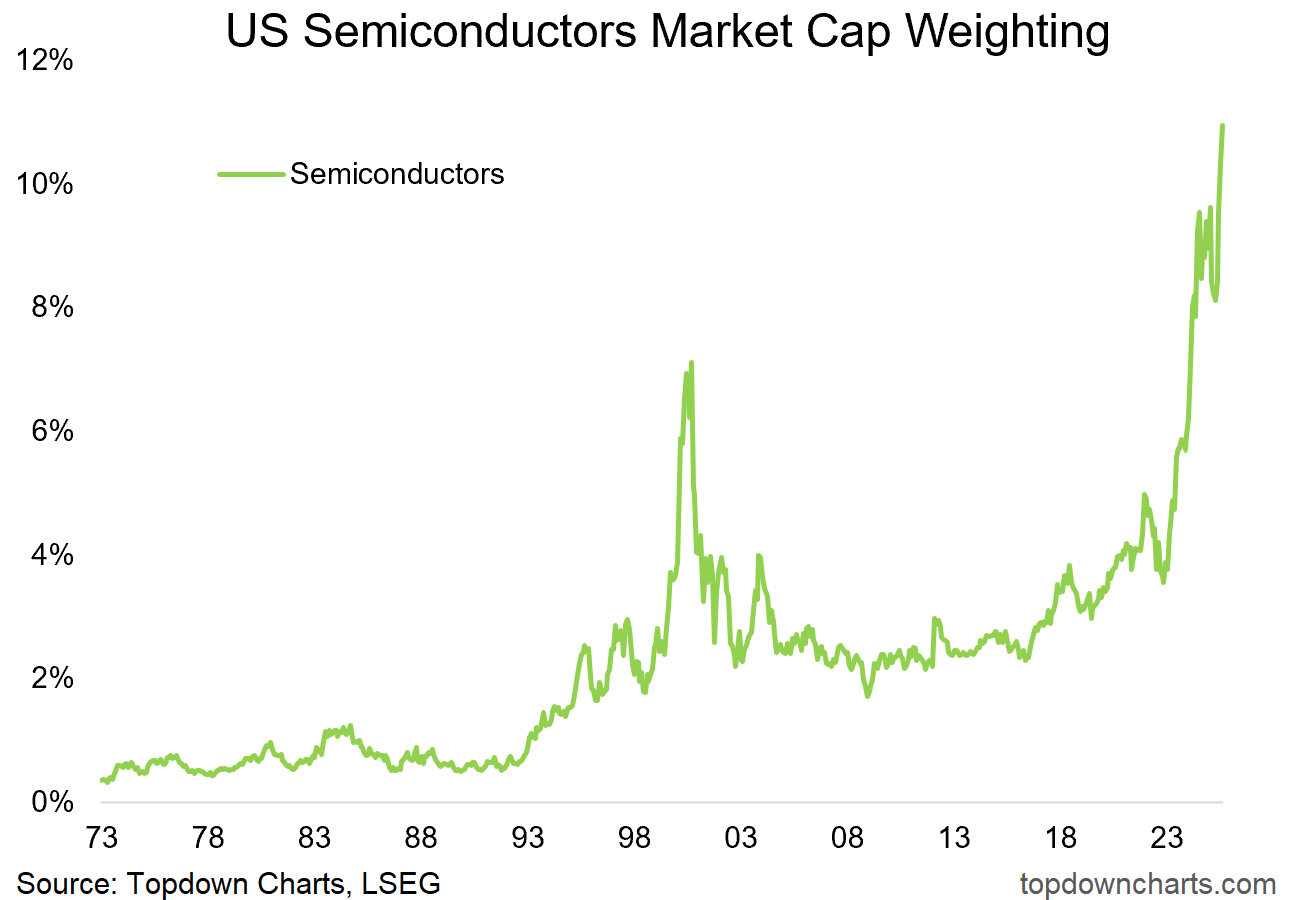
Source: Chart of the Week - Speculation Heights
3. Studies in Markets — Sector History Lessons [Big Sectors]: First up is a look at the percentage weight of the largest sectors in the US stockmarket since the 1800’s. The thing that immediately stands out is that sectors can get really big and stay big for some time, especially during technological innovation and industrialization cycles (e.g. the rise of transports, energy, and the modern day rise of tech).
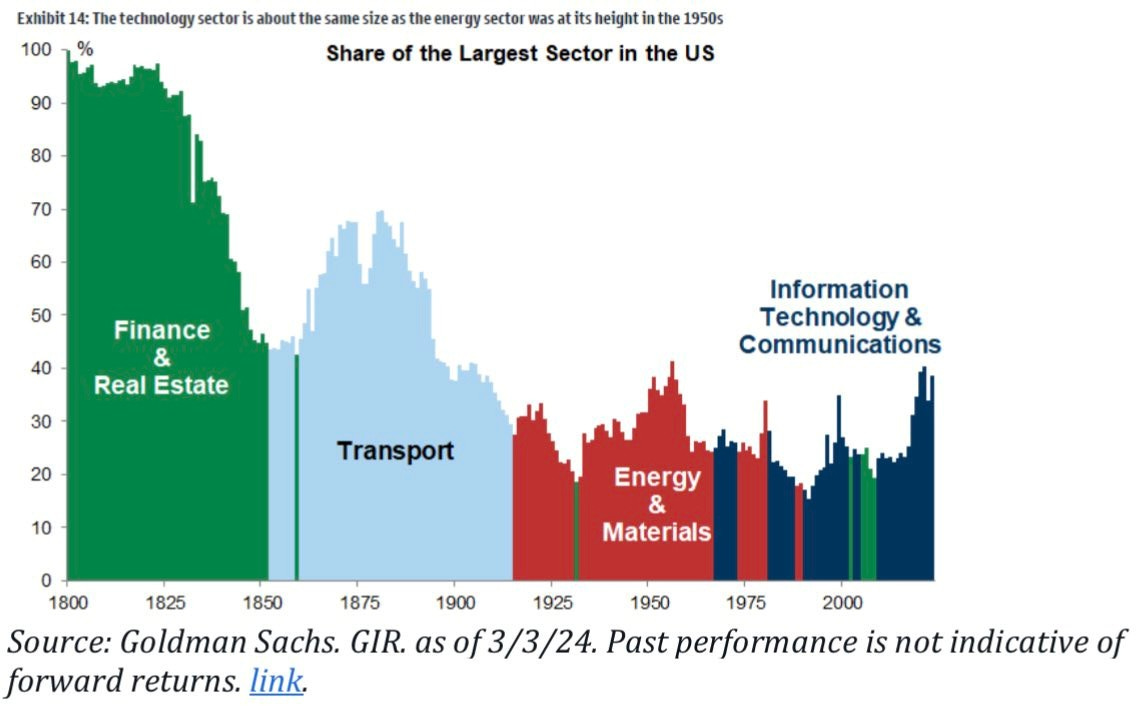
Source: Weekly S&P500 ChartStorm - 17 Mar 2024 [ @Marlin_Capital ]
4. Studies in Markets — Sector History Lessons [Big Stocks]: We see the same dynamic illustrated slightly differently with the largest stock — a good example is General Motors being the largest stock for decades during the rise of autos, with IBM, GE, Exon Mobil, and Apple also serving their times. The key point is when you get revolutionary and even just cyclical (e.g. commodity supercycle) changes happening in the economy, business, and markets, it’s only natural to see the leader or posterchild of that theme rise to the top (e.g. as now with NVDA and the AI revolution).
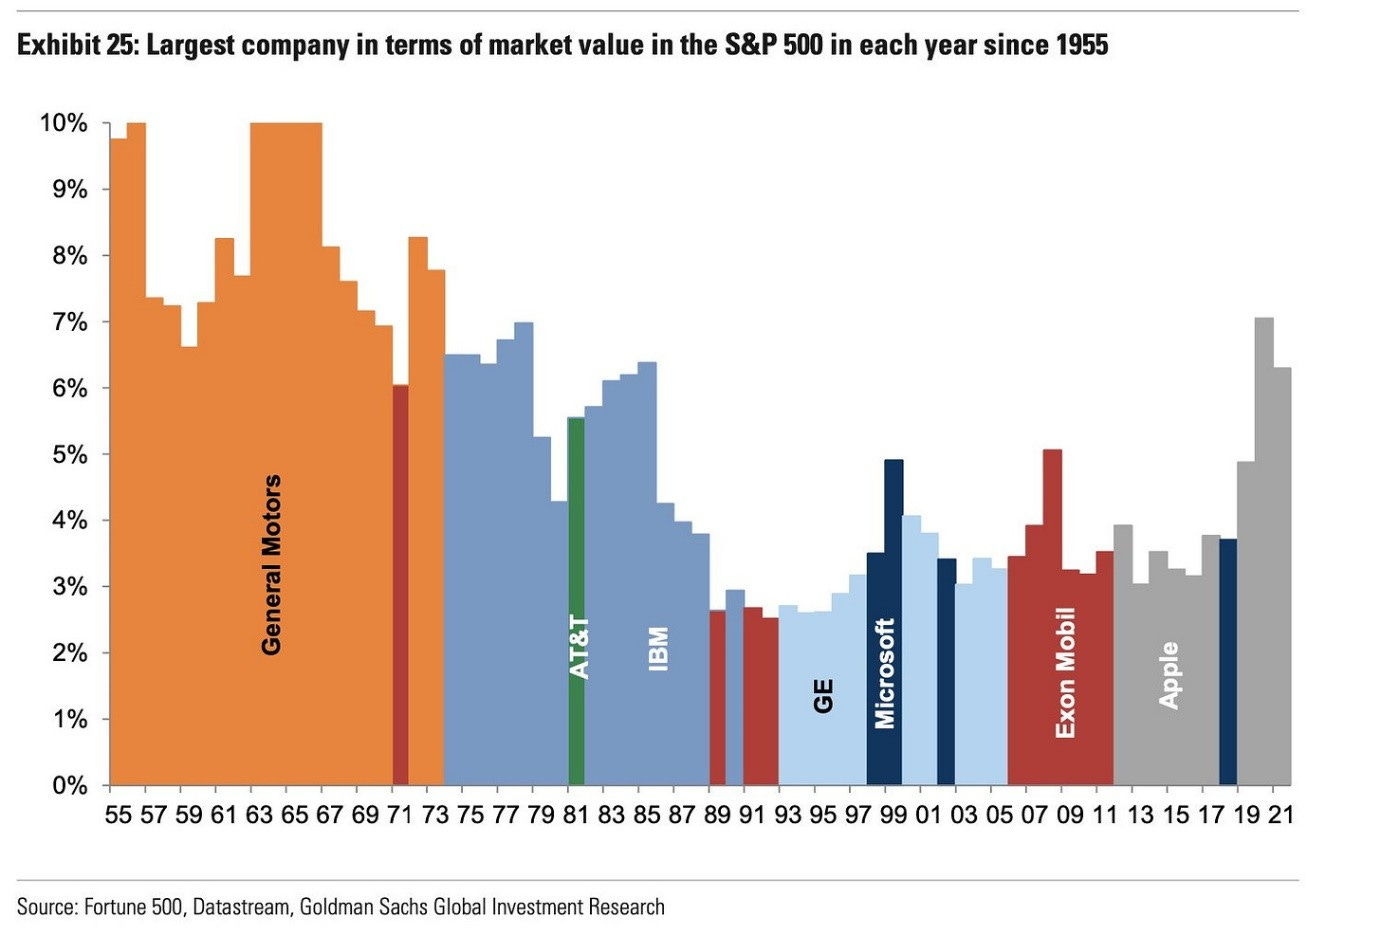
Source: Weekly S&P500 ChartStorm - 31 Mar 2024 [ Daily Chartbook ]
5. Studies in Markets — Sector History Lessons [The Rise of Energy]: But this one I think is particularly informative; this chart shows the rise of the energy sector from 3% in 1912 to 18% in 1921… and then spending decades in cycles of boom/bust. I think this could be a good analog for semis — it’s hard to imagine a world where semiconductors do anything other than become more important, but we likely will see that ebb and flow over time… and when it came to the energy sector there were many extremes over the years that marked cyclical peaks and troughs.
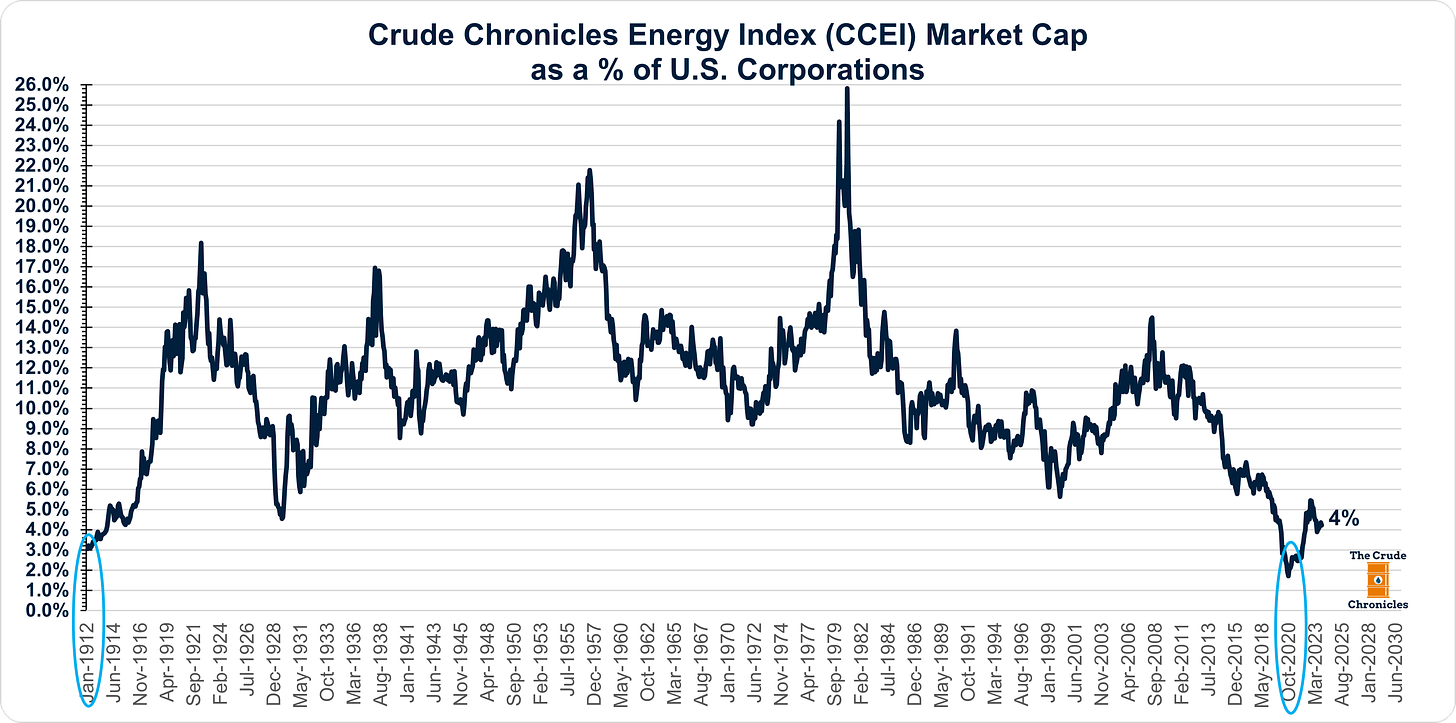
Source: Weekly S&P500 ChartStorm - 3 March 2024 [ The Crude Chronicles ]
6. Studies in Markets — Sector History Lessons [Contemporary Perspectives]: Which brings us to today’s market… While the rise of semis is certainly stark, it’s not the only thing going on in market cap weightings. The Tech “Super Sector” (which corrects for the GICS reclassification that removed a bunch of tech stocks from the tech sector and put them in things like communication services and consumer discretionary) has surpassed the dot-com bubble heights, and at the other end of the spectrum, the defensive sectors (consumer staples, utilities, healthcare) have reached a record low weighting —and even traditional cyclicals (financials, industrials, energy, materials) have been crowded out.
Passive index investors take note: the average index investor has been drifted into a portfolio that is tech heavy and light on defensives + diversification.
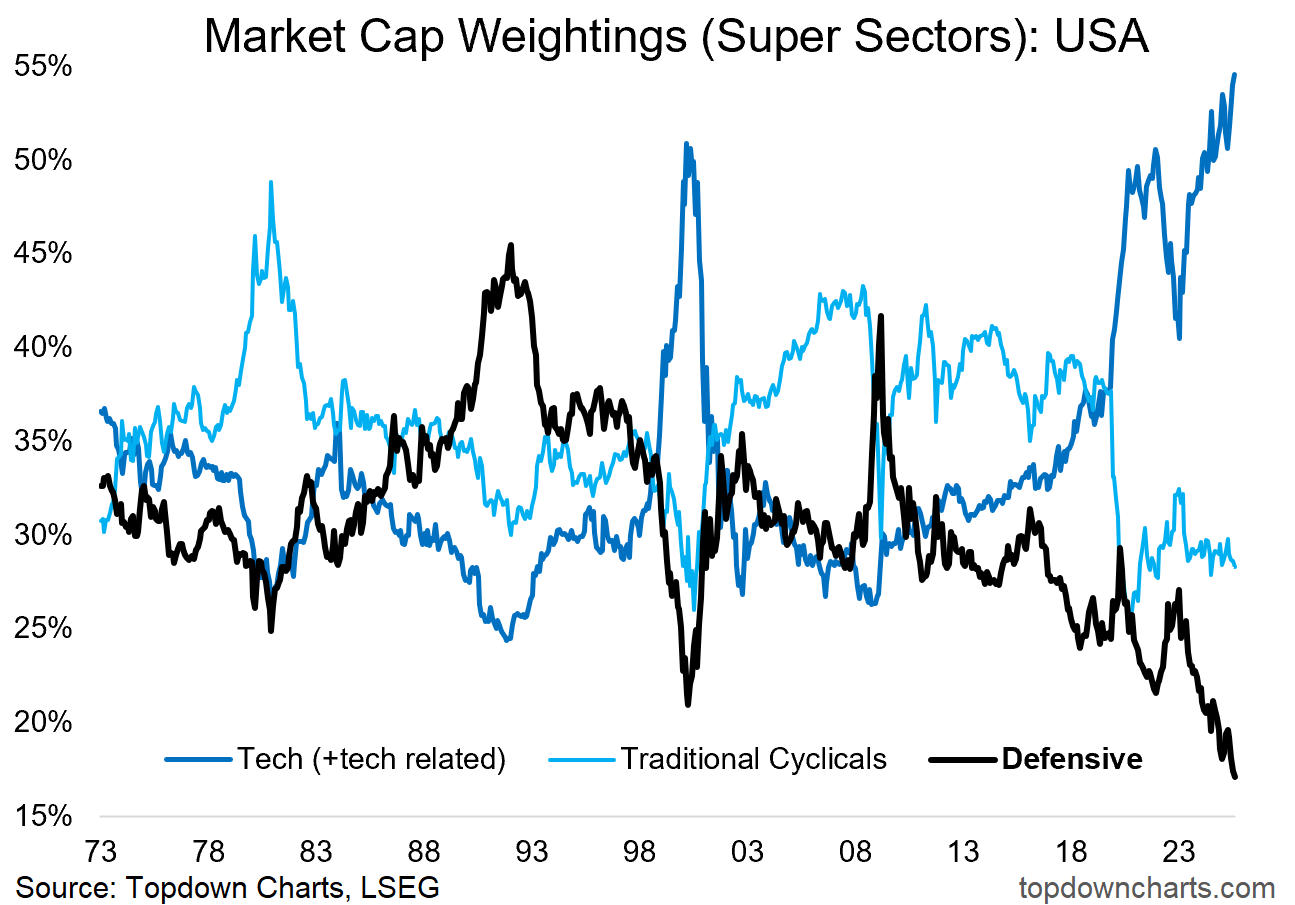
Source: Topdown Charts
7. Post-Dot-Com-High: And then moving on, you also notice that aside from the typical index investor hodling a tech-heavy portfolio, it’s also an increasingly expensive portfolio. The combined PE ratio for US tech stocks has risen to new post-dot-com heights. We are late in the cycle… but which cycle?
