
Weekly S&P500 ChartStorm - 17 Mar 2024
This week: enter the doji, euphoria, flows, speculative frenzy, stockmarket vs economic sentiment, cycles, the rise of tech, foreign holdings of US stocks, US tech supremacy...

Welcome to the latest Weekly S&P500 #ChartStorm!
Learnings and conclusions from this week’s charts:
The weekly “doji” denotes indecision following a strong run.
Euphoric sentiment indicators suggest a speculative frenzy taking hold.
Smart money remains skeptical (albeit reluctant FOMO bulls).
Foreigners are disproportionately buying US Stocks.
US tech stocks trade at a 2-3x premium vs global tech stocks.
Overall, I feel like not that much has changed since I unplugged just over a week ago for a family vacation — the market politely went sideways during that time, thanks market :-) There’s still things to be concerned about, and still bullish momentum. But what does stand out: the doji formation, the sideways movement, toppiness in tech/bitcoin …coming at a time where sentiment is all on one side of the boat, and seasonality is turning slippery. Maybe some market volatility is set to pile-on to my email backlogs!
1. Enter the Doji: First up is the appearance of an interesting pair of weekly candles known as “doji” (where the open/close are almost identical). These represent an element of indecision, and can indicate exhaustion and possible reversal risk following an extended move (like the one we have just seen).
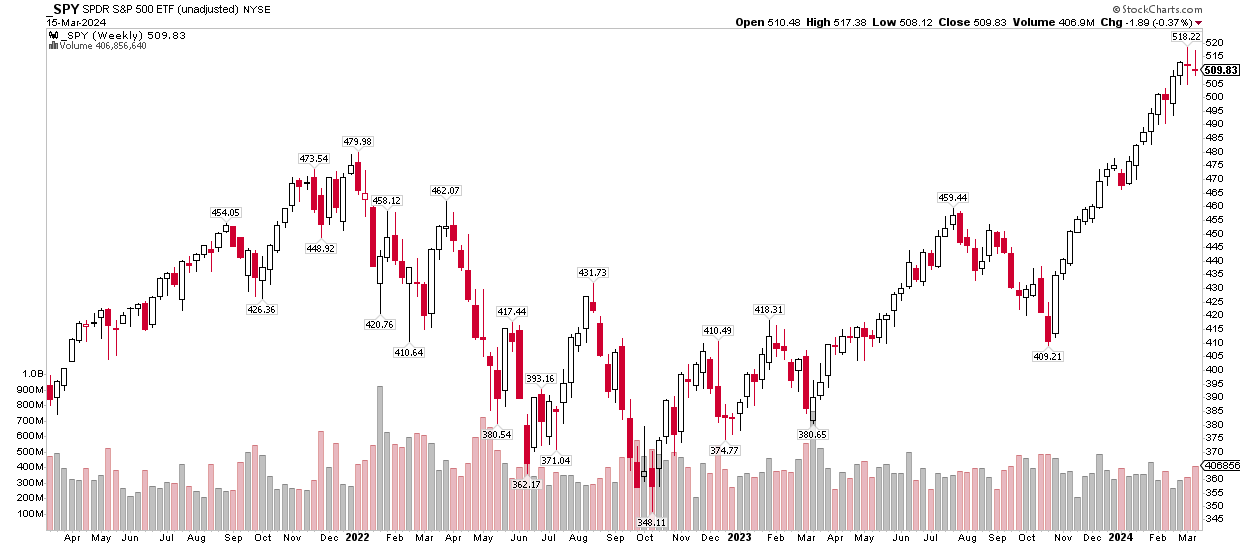
Source: @MikeZaccardi via @TheChartReport
2. Euphoria Rising: But while the weekly candles show some indecision, investor sentiment is decidedly bullish — investor euphoria at the upper end of the range.
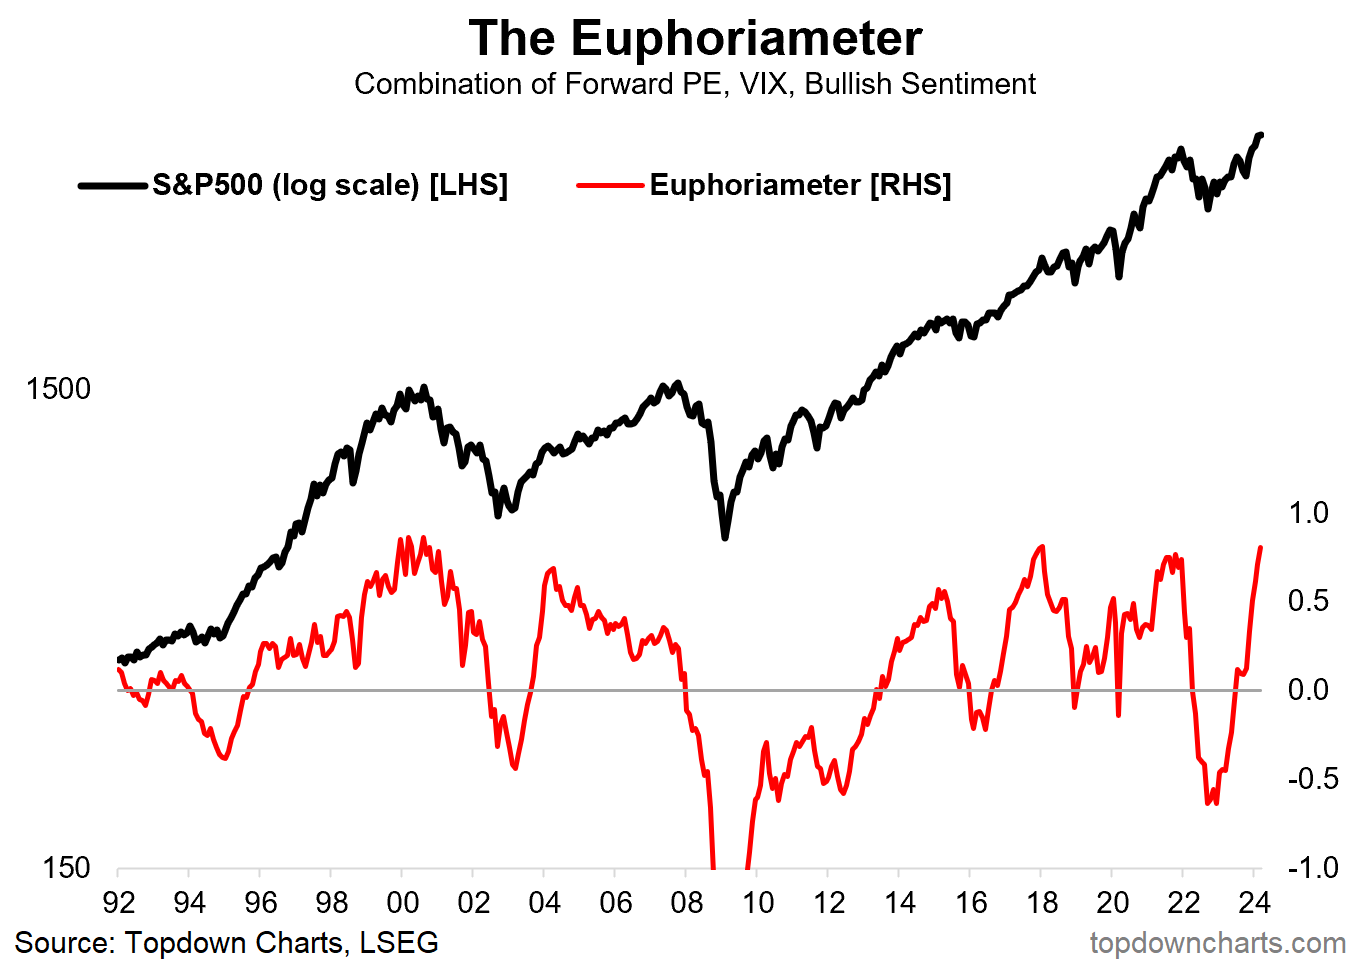
Source: The Euphoriameter
3. Flows Show: Similarly, US equity fund flows show clear FOMO.
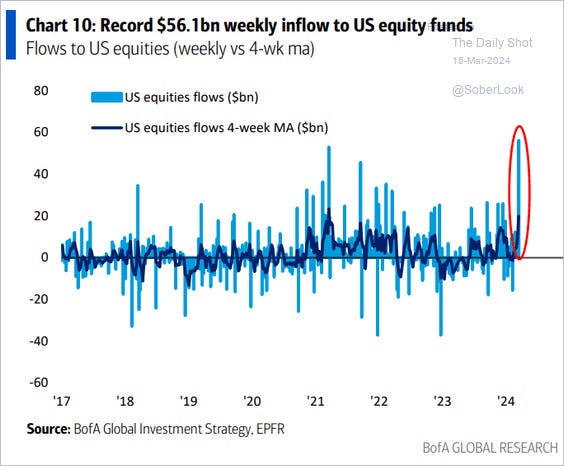
Source: Daily Shot
4. Speculative Frenzy: Trading activity in leveraged long vs short US equity ETFs has reached frenzied levels — at this point one of two paths lie ahead: either a repeat of the pandemic stimulus/liquidity-fueled bubble of 2021, or the market takes a short-term breather.
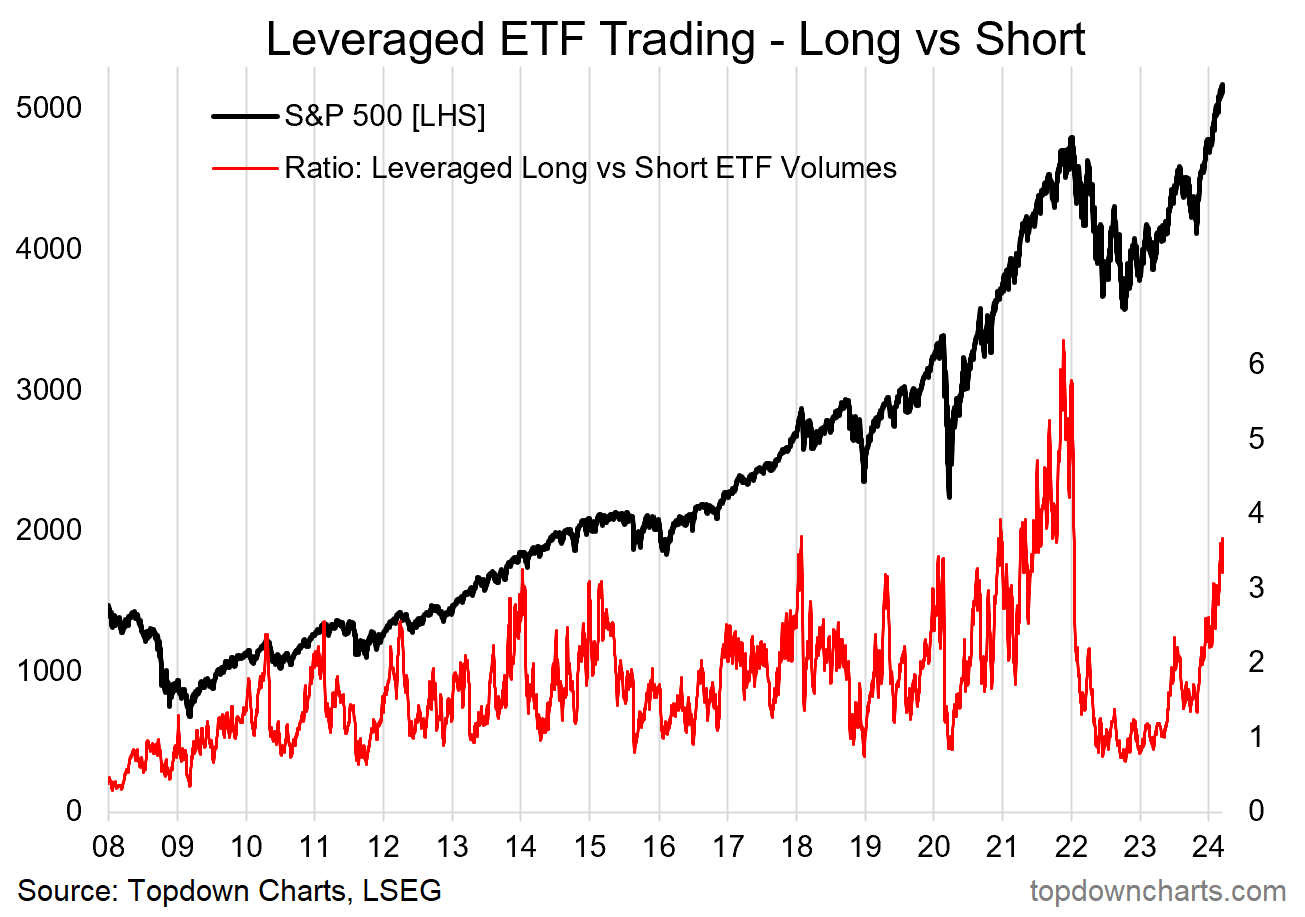
Source: Topdown Charts Topdown Charts Professional
5. Stockmarket vs Economy: Interestingly, when it comes to investor sentiment (surveys of investors); optimism and bullishness is the overwhelming feeling… when it comes to economic sentiment (surveys about economic activity, expectations); pessimism and recession remain the mood. One of these is going to have to do some moving the close that gap.
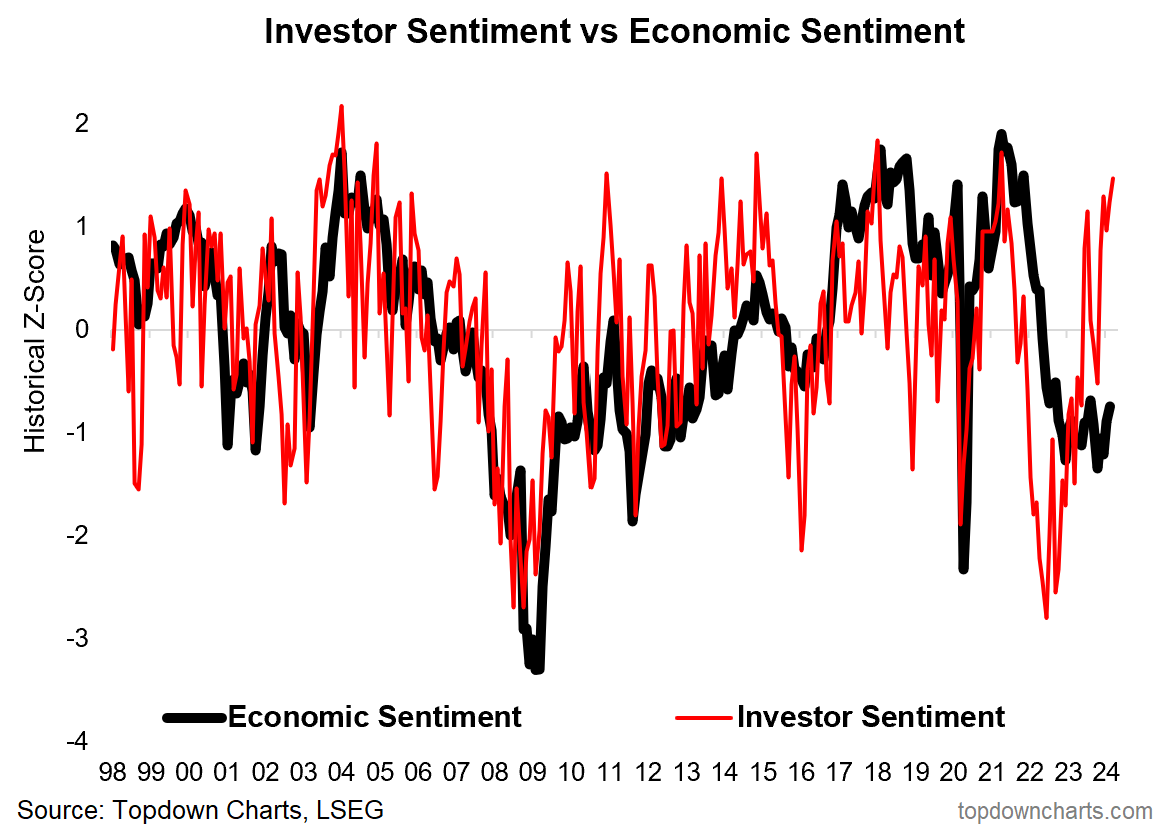
Source: Topdown ChartsTopdown Charts Professional
6. Investment Managers of 2 Minds: Similarly, investment managers appear to be reluctantly taking risk, while not expecting much upside… a situation of lingering concerns on valuations and (geo)politics, but elements of FOMO as “stocks only go up” (set against the very real and ever-present peer/benchmark risk).
