
Chart of the Week - Global Equity Technicals
Chart in-focus from the latest Weekly S&P500 ChartStorm

Note: this is a new series for free subscribers and is intended to give an insight into the work that goes into The Weekly ChartStorm + provide a little further explanation on charts and concepts.
This week’s chart is one for the bulls.
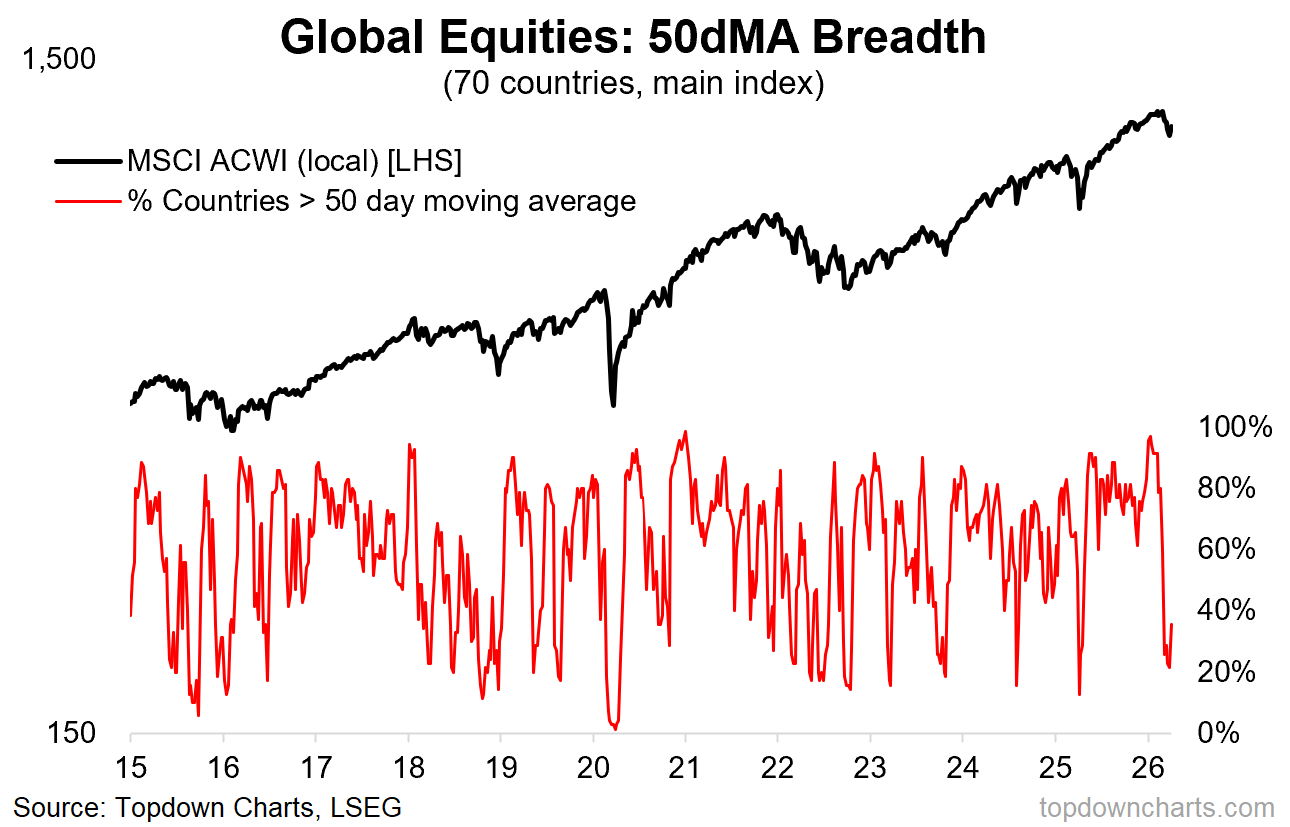
It shows the MSCI ACWI (All Countries World Index) aka Global Equities in the black line, and 50-day moving average breadth in the red (i.e. what percentage of countries are trading above their 50-day moving average).
Breadth indicators like this tell you a couple of things.
First, they give you an early heads up on global developments as the impact spreads across countries.
Second, for a shorter moving average timeframe like 50-days, it operates as an oscillator. In other words, it gives you overbought/oversold signals.
In traditional market analysis a true overbought signal is when an oscillator like this goes to an extreme high —and then rolls over.
That second part is key.
The reason is you can get an overbought market that stays overbought and gets even more overbought, so the turning point is what gives you confirmation that a change is underway.
Interestingly, we actually got exactly these conditions just prior to the March selloff (funny how events/news/catalysts tend to show up when a market is technically “ready”).
And then on the oversold side of things, we also have a textbook example unfolding right before our eyes.
A true oversold signal comes when an oscillator goes to an extreme low —and then turns up. That’s exactly what is happening in global equities right now.
To be clear, this is a very bullish short-term chart.
Now of course it is anyone’s guess as to what comes next, and geopolitics for example could cut either way (e.g. could get better [ceasefire] or worse [regional escalation] —albeit some might argue it can’t get much incrementally worse).
And yet, as I noted the other day, there are some bright spots in the global economy, and sometimes you just have to shut up and listen to what price is telling you …(especially when everything and everyone else is telling you all sorts of conflicting messages).
Bottom line: global equity technicals are short-term bullish.
REMINDER: activate a 3-month free trial to the Weekly ChartStorm now so you can access the latest report, join the Q&A discussions, and get a flow of insights and ideas like those discussed above.
Thanks for reading!
For more info on the Weekly ChartStorm service see:
Report Samples (what you get as a subscriber)
Subscriber Reviews (what paid subs think about it)
Benefits of Subscribing (why you should buy)
If you’re new to The Weekly ChartStorm, or you’ve been thinking about a subscription but want to see more first, here’s something for you to try — a 3-month Free Trial.
Note: that link will prompt you to go through the usual subscription process, but you will not be charged until the end of your 90-day trial period — and you will not be charged at all if you cancel prior to the trial end (and yes, you will receive reminders closer to the time).
Lastly, be sure to reach out at any time if I can help with anything. I promise to leave no questions unanswered and no problems unsolved.
—
Best wishes,
Callum Thomas
Founder & Editor of The Weekly ChartStorm
and Head of Research at Topdown Charts
Twitter/X: https://twitter.com/Callum_Thomas
LinkedIn: https://www.linkedin.com/in/callum-thomas-4990063/
Already a paid subscriber?
Log-in and read the latest report here:

.