
Weekly S&P500 ChartStorm - 5 April 2026
This week: investor sentiment, economic sentiment, seasonality and studies, longs vs shorts, tech sentiment, big tech value, AI output, deadlines, global equity technicals...

Welcome to the latest Weekly S&P500 #ChartStorm!
Learnings and conclusions from this week’s charts:
Investor Sentiment is down, Economic Sentiment is up.
Markets appear to be following the Trump Weave.
Oil Shock Analogs highlight the worst case.
Tech sentiment is deeply oversold.
Global equities are up from oversold +positive April seasonality.
Overall, there seems to be a growing body of evidence for a rebound.
n.b. In case you missed it, check out my Q2 Update to the 10 Charts to Watch in 2026
1. Sentiment Survey Composite: the combined surveys (4 different surveys) investor sentiment signal is now into net-bearish territory — this is a stark contrast to one of the most consensus bullish optimism readings around the turn of the year.
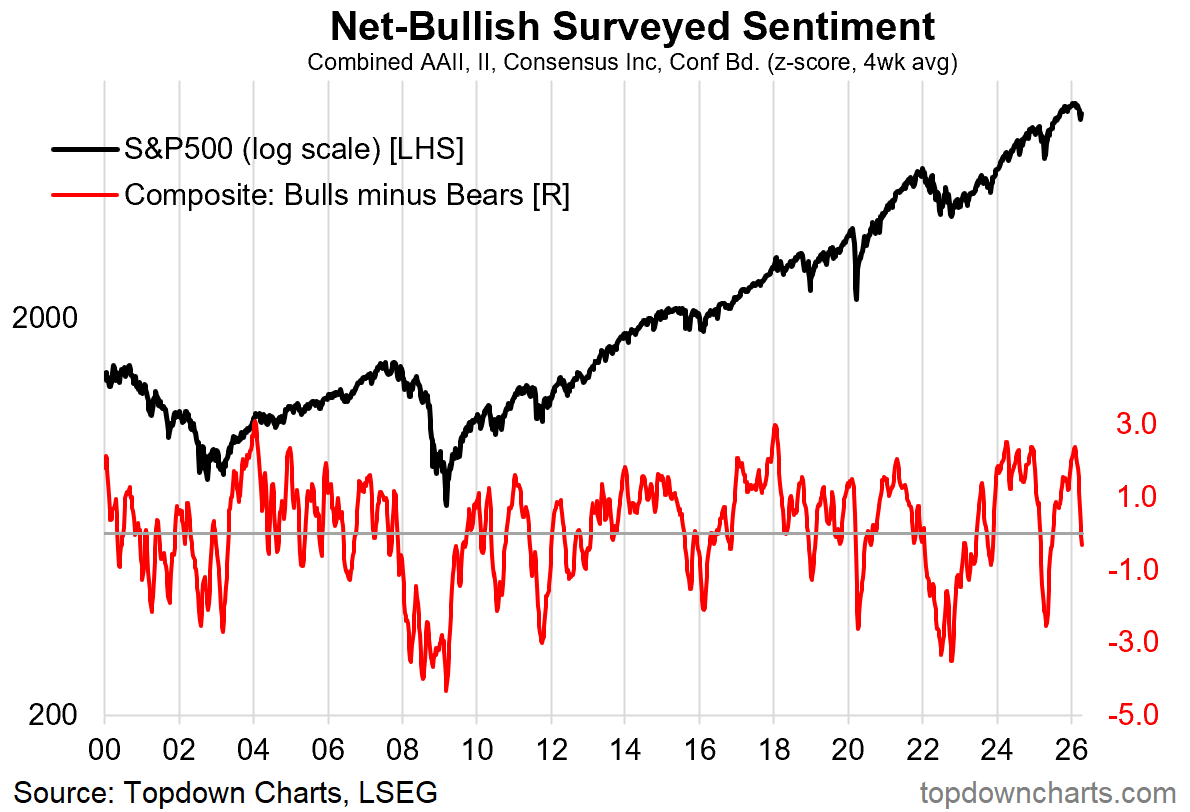
Source: Topdown Charts Professional
2. Economic Sentiment: meanwhile the combined surveys (7 surveys) Economic sentiment signal is net optimistic and trending higher. This is a positive sign for the bulls, basically it says the economy is doing fine, and markets are doing their usual greed-to-fear oscillations.
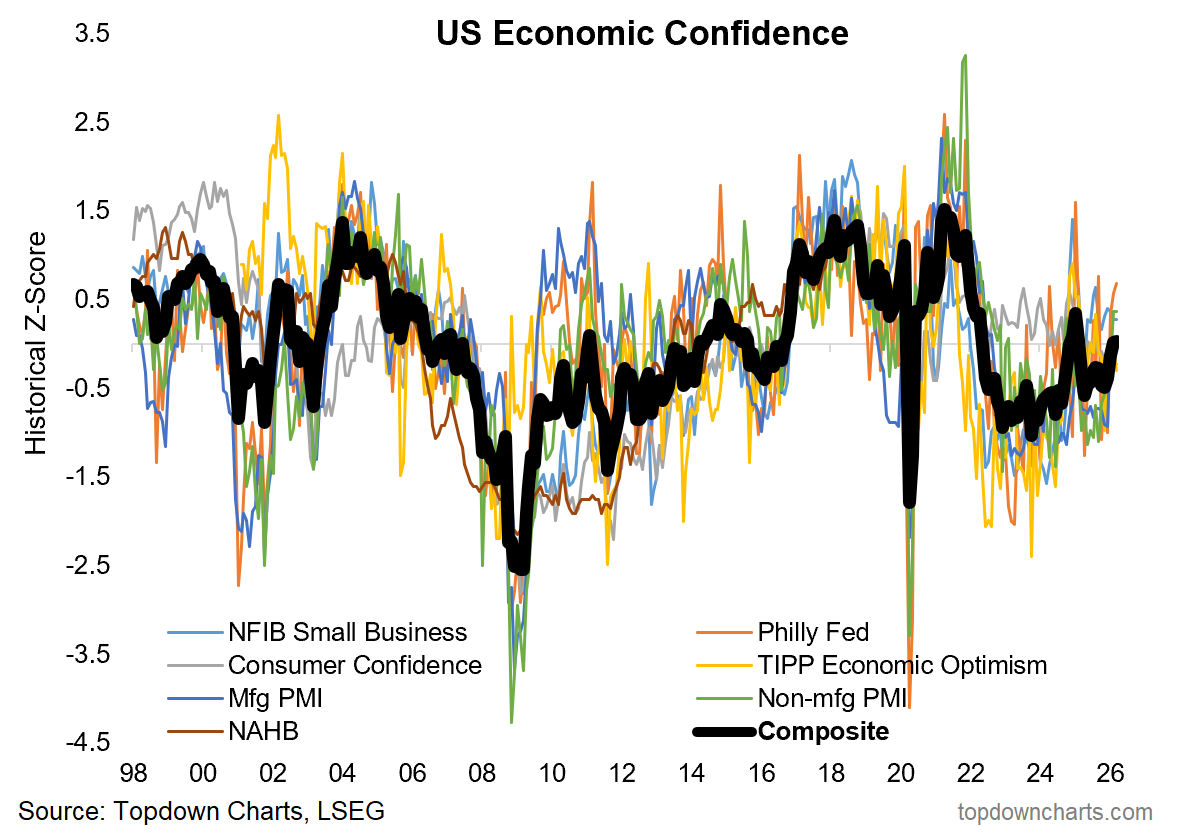
Source: Topdown Charts
3. The Weave — Markets Edition: here’s a novel take on seasonality; markets during Trump presidency years (albeit, n of 5). If markets follow the usual “Trump Weave” then we might well be done or nearly done with the current correction.
