
Weekly S&P500 ChartStorm - 8 February 2026
This week: bullish rotation, cash allocations, investor positioning, global equities, disclosure, EM fund flows...

Welcome to the latest Weekly S&P500 #ChartStorm!
Learnings and conclusions from this week’s charts:
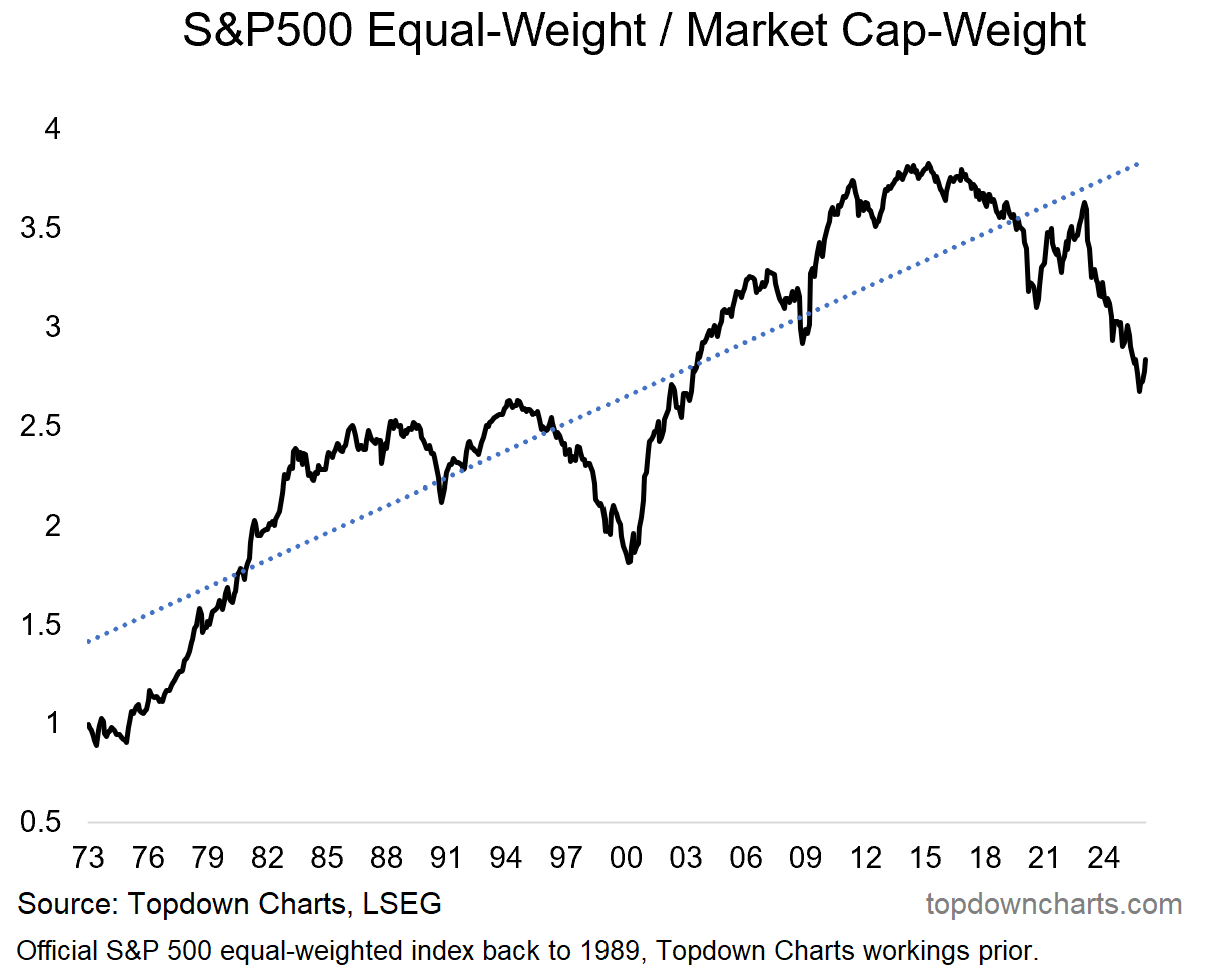
The S&P500 equal vs cap weight ratio is at an inflection point.
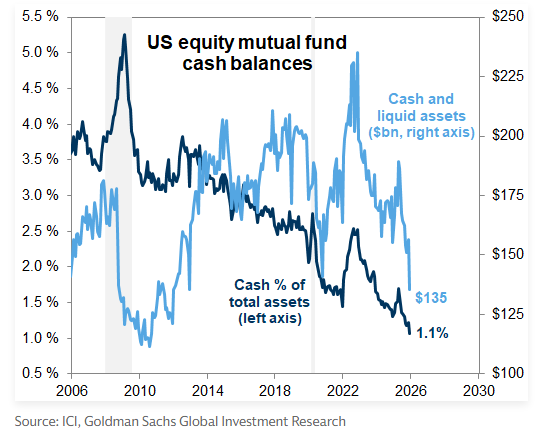
Investor cash allocations are at cycle lows.
(equity allocations are at cycle highs)
Global vs US equities are also at an inflection point.
Despite some overheating in EM equities, there’s room to run.
Overall, while last week saw some particularly turbulent price action within tech (especially software slumping as a result of AI disruption/threats), we’ve seen further progress on bullish rotation and bull market broadening. And in case I didn’t make myself clear, Rotation is the big theme right now…
1. Equal/Cap-weight Rotation: chart of the year?
After a major deviation from long-term trend the equal-weighted version of the S&P500 is rebounding vs the market-cap-weighted version.
This is partly due to better prospects for some of the previously unloved and undervalued sectors (e.g. energy, materials, staples; real world things that are hard to disrupt by AI and may even benefit), but also the coming-unstuck of some of the previously overhyped and overvalued sectors (e.g. software, which has been heavily sold recently due to AI disruption). This inflection point seems durable.
(n.b. over the long run equal-weight has tended to outperform cap-weight because valuation mean reversion and creative destruction are the rule)
Source: Topdown Charts
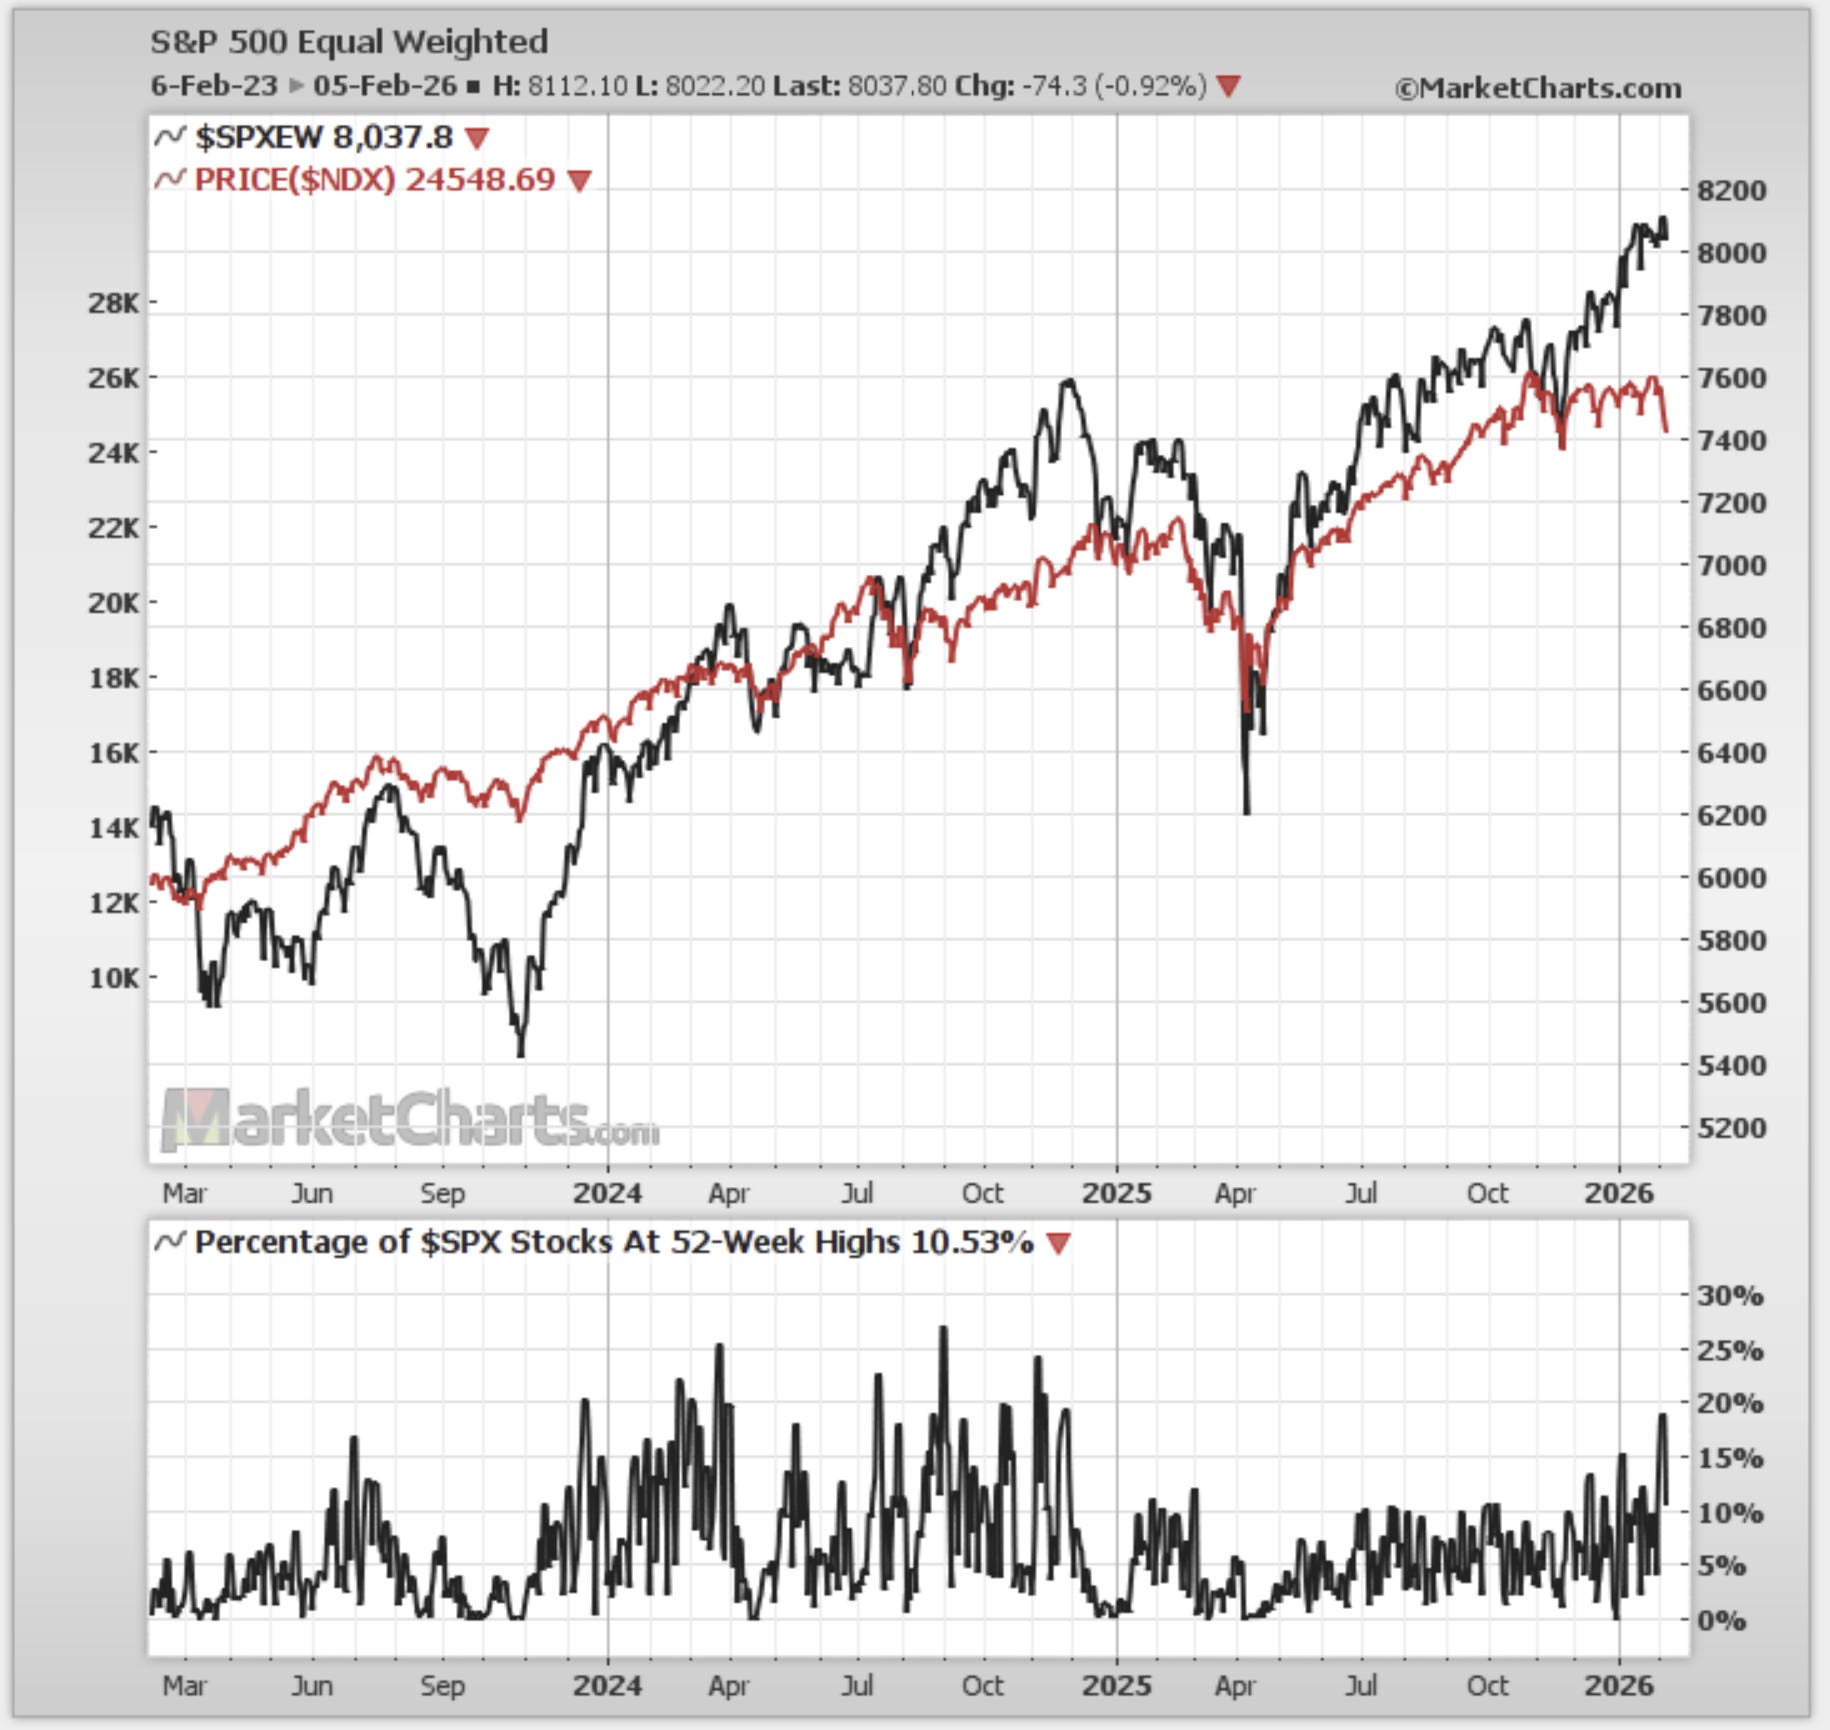
2. Equal-Weighted-Winning: here’s why — if you look at the breadth of the S&P500 we are seeing more and more stocks making new 52-week highs (aka bullish broadening) and the SPXEW (equal-weighted S&P500) is making new highs itself and looks great technically.
Whereas the Nasdaq 100 peaked months ago (as mentioned last week), and is undergoing the greatest amount of creative destruction in years with it turning out so far that the biggest winners vs losers of AI disruption are actually within tech… not to mention that many AI winners had probably run a little too far too fast to begin with. So again, betting on rotation seems like the easy answer.
Source: MarketCharts.com
3. Low Cash (Fund Managers): meanwhile fund managers are simply betting on anything (but cash). It’s logical to see cash levels get run down during a bull market like this as investors (and HR/rem committees) tend to punish cash drag.
From a cycles/timing point of view though, it reminds you a bit of late-2021/early-2022 — sharp run-downs in cash leave little in the way of dry powder.
Source: @MikeZaccardi
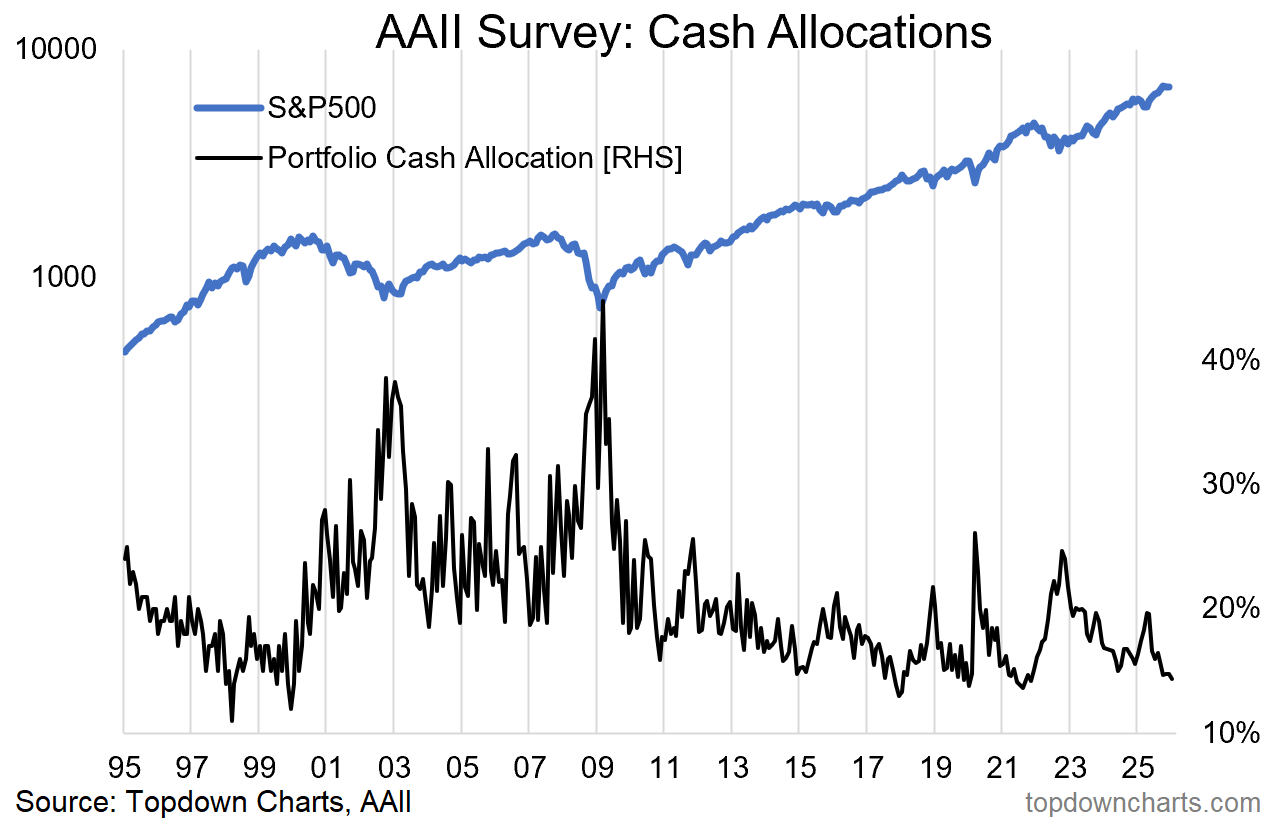
4. Low Cash (Retail): and retail too; surveyed portfolio cash allocations have reached the lowest level since the 2021 market peak.
With cash allocations at what you might call warning levels, that bull market broadening and bullish rotation theme better come through!
5. Allocation Heights: and on the topic of rotation and risk, with equity positioning at the upper end of the range, in lieu of new money in — rotation is the answer for keeping the bull market machine running.
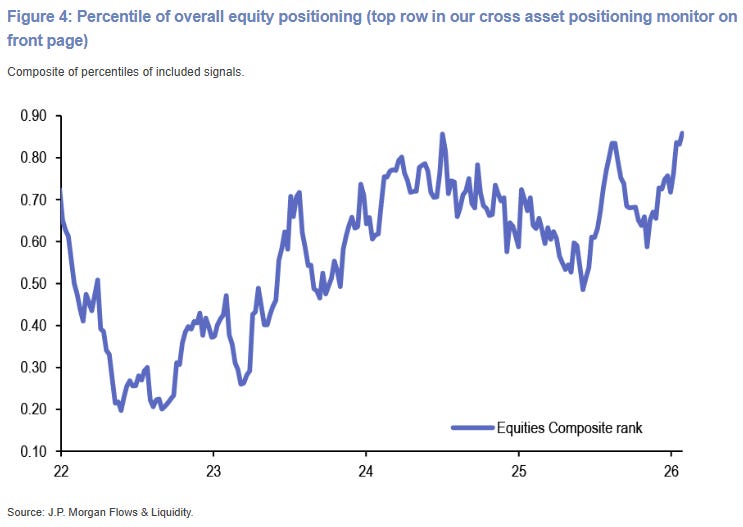
Source: @BlakeMillardCFA
6. Global Equity Bull Market: meanwhile, the global equity bull market is going from strength to strength. The rotation is not just within US markets, but also US-to-global (and p.s. you can get rotation as a result of new money flowing to global when it might have in the past flowed to US… as opposed to money flowing out of one market and into the other; so it doesn’t necessarily have to be zero-sum or minus-sum).
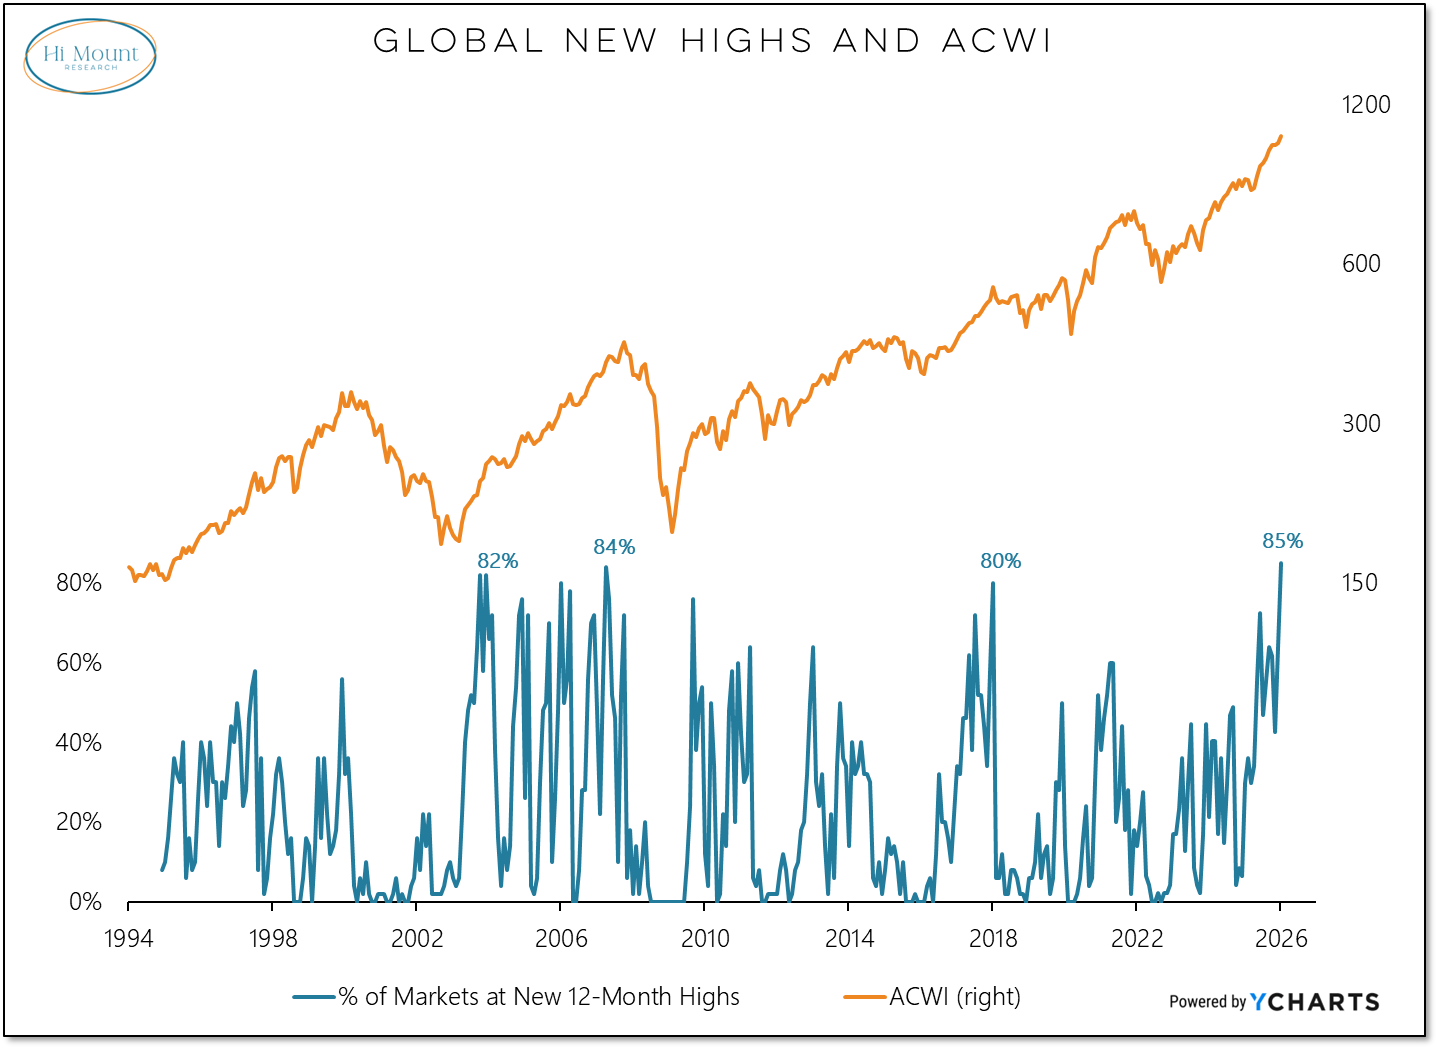
Source: Global Bull Market For Stocks Remains Intact
7. Taking Off: the global airline industry ETF, JETS is taking off after cruising through a fairly turbulent holding pattern since 2020.
I thought this one was interesting for a couple of reasons; first it’s just plane technically interesting, second it’s an example of some of the cyclical winners that are emerging as part of the bullish rotation trade (both within US markets and globally).
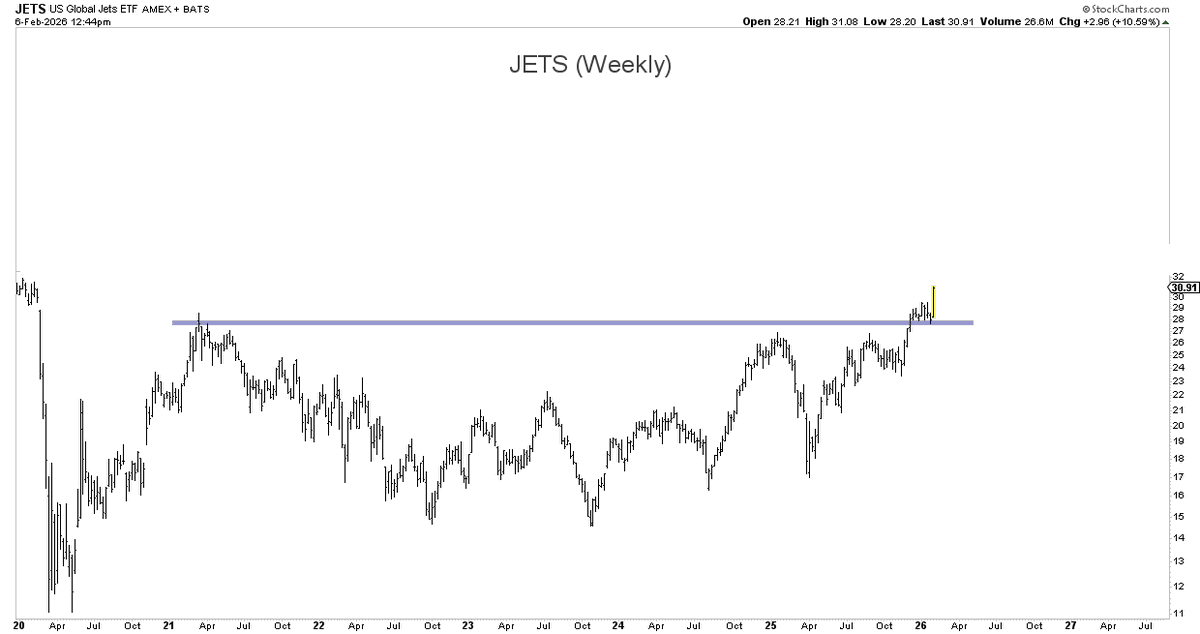
Source: @alphacharts
8. Get Rotated: back on the global vs US rotation theme, this chart shows relative price performance in the dark blue (clear turning point in progress), and relative earnings performance in the light blue. We can see that relative valuations have been the biggest mover here, and that’s not surprising because price moves faster than fundamentals (i.e. we likely see follow-through later-on in relative earnings).
But the other thing is it’s important to emphasize that yellow line — we are coming from a historically extreme stretched relative value starting point (room to run).
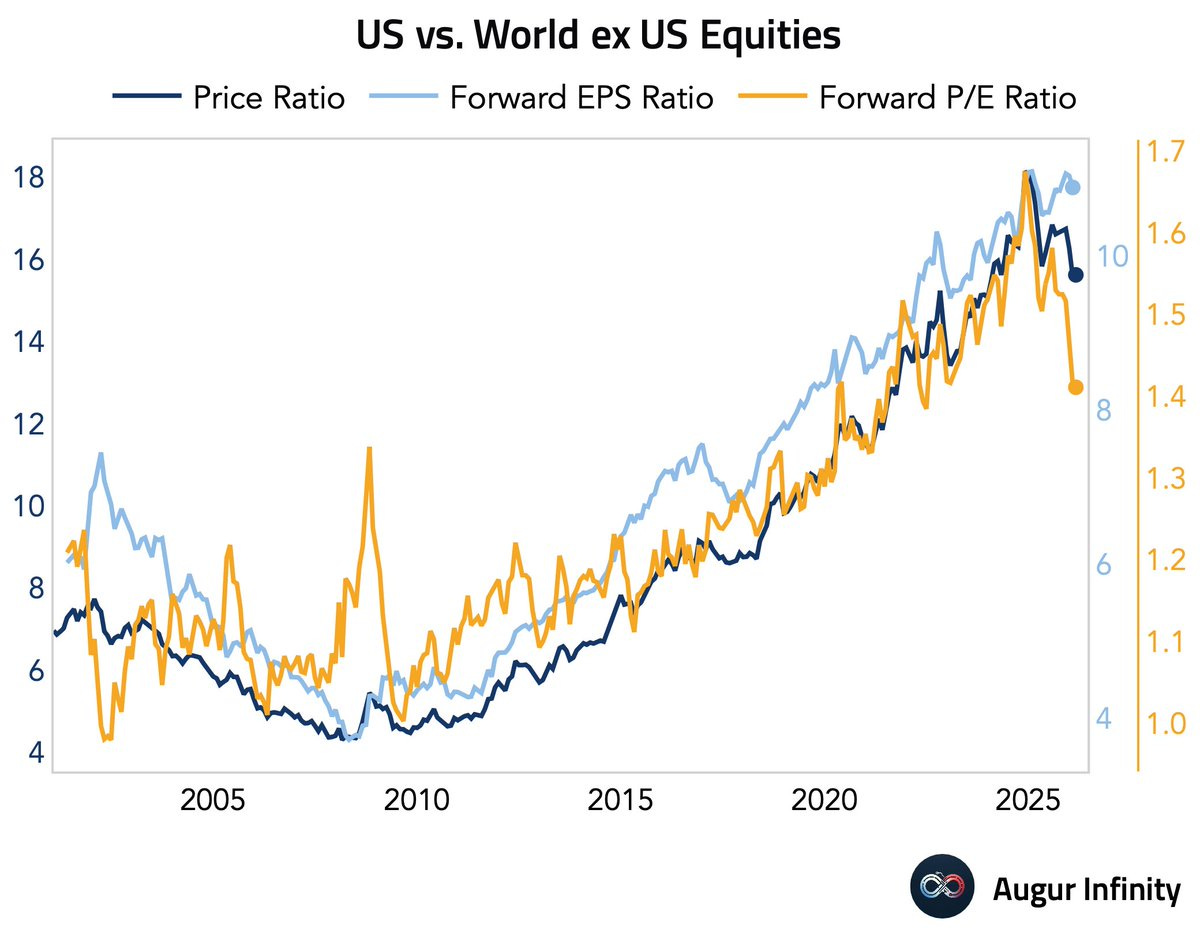
Source: @AugurInfinity
9. Buybacks: one fundamental support to global vs US rotation is that share buybacks are really starting to catch-on around the rest of the world. As Schroders’ chart below shows, Japan and Europe have significantly closed the buyback gap vs US, and even EM is starting to move (which have historically been a notorious capital diluter). Again: room to run.
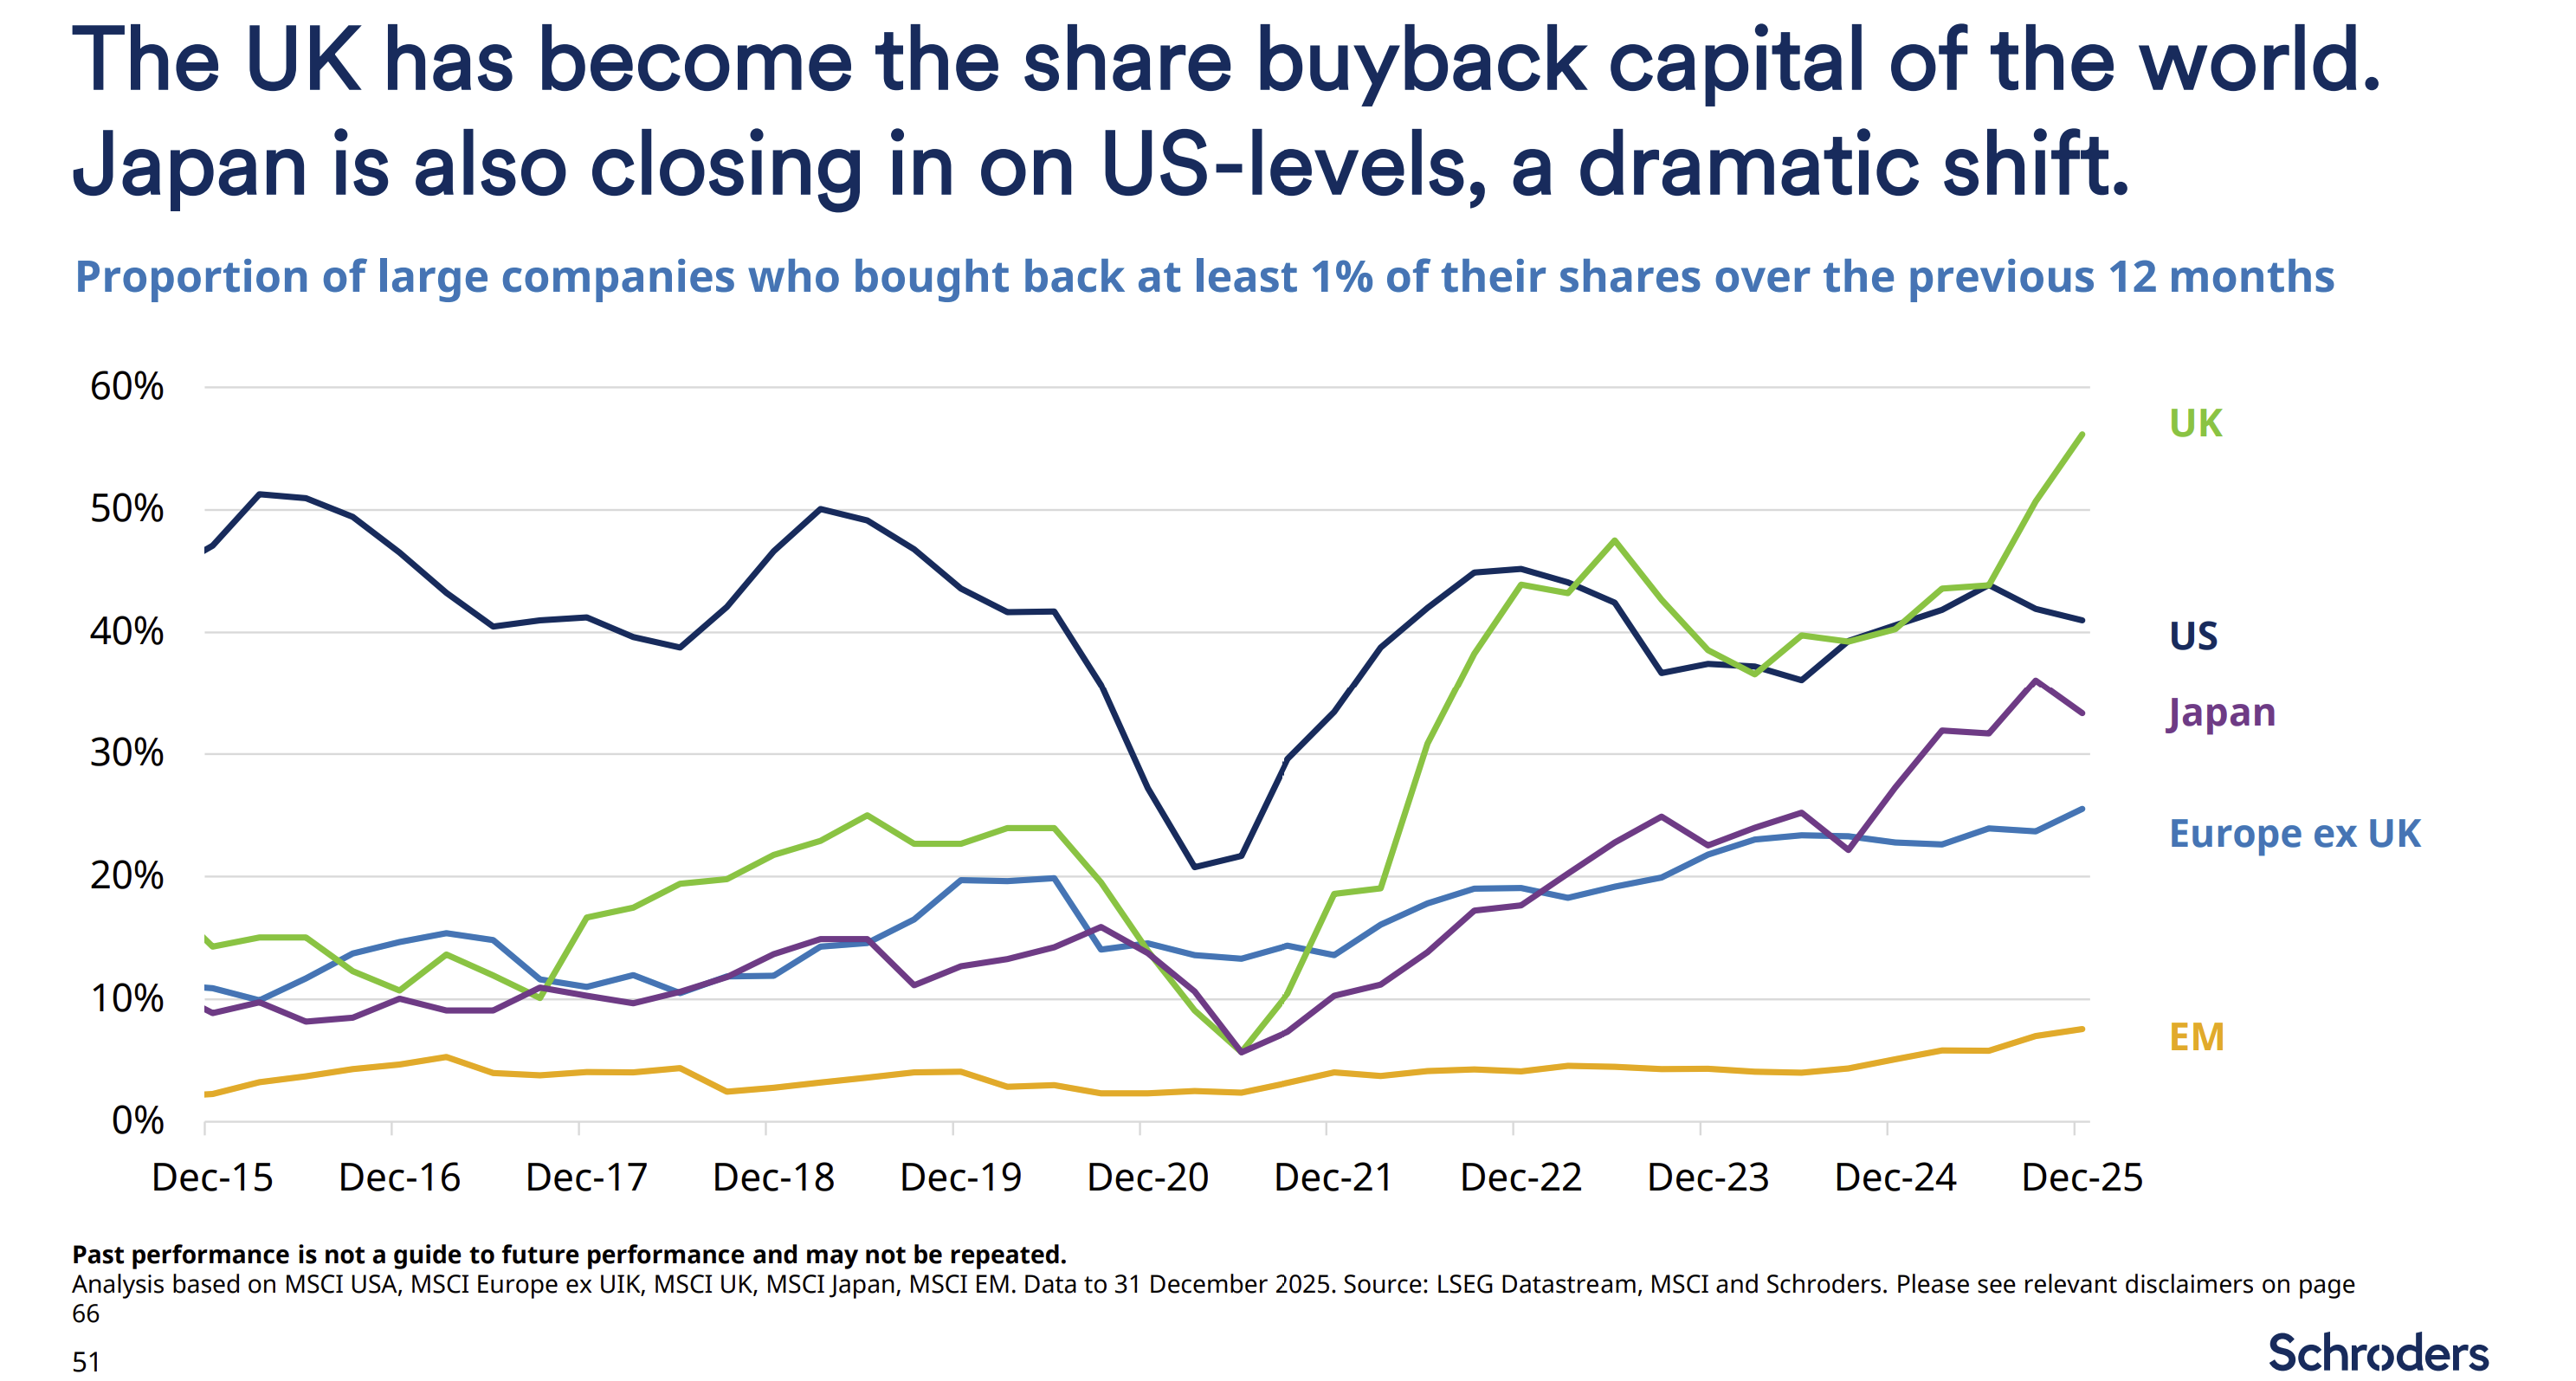
Source: Schroders via SnippetFinance
10. Disclosure? in case you haven’t been tracking it, there’s been increasing momentum on the concept of “disclosure” (basically the idea that the government has been hiding the truth/facts around non-human-intelligence (NHI) contact and “UAP” (unidentified anomalous phenomena), including claims of being in possession of NHI technology and running reverse engineering programs e.g. see the recent documentary ‘Age of Disclosure’).
And now we apparently have a way to invest in this, what could be one of the biggest macro-market themes of all time with Tuttle launching its new UFOD ETF.
It’s been one of my many niche interests for years, and my read is there are a lot of breadcrumbs leading to there being something to this… BUT, as much as I find the topic interesting and this idea cool, the possibility field is far too wide open at this point —it’s hard to know who will win/lose when we don’t know what the news might be, when it might come, or the specifics/timing/impact, etc.
In other words, I would say I am certain that there is life out there (and easy to make the case for contact/visitation), but uncertain on the impact and timing that some sort of Disclosure Day might have (and ultimately, from the experience of recent years you can guess the geopolitical event right, but get the market impact wrong!). In any case, I’ll be watching this with interest.
Source: @EricBalchunas & @TuttleCapital
Thanks for reading, I appreciate your support!
Portfolio Strategy Notes — EM Fund Flows
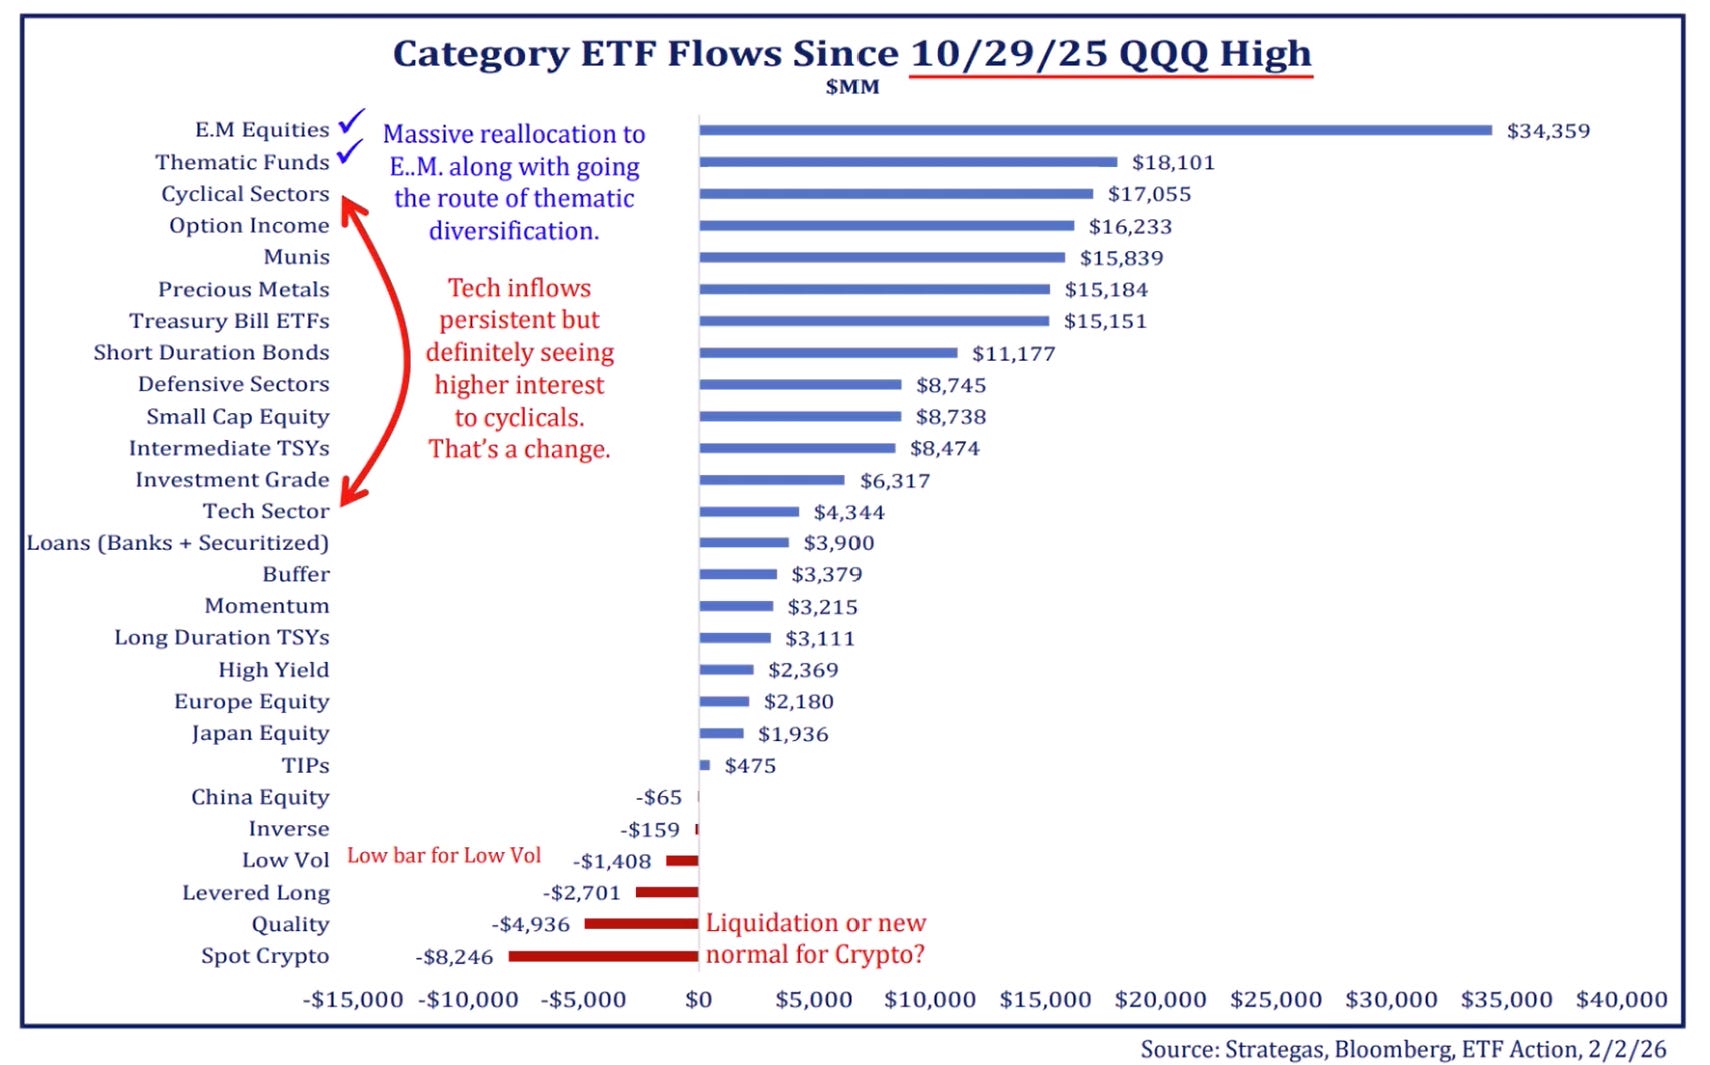
Back down to earth, a number of sources have reported massive fund flows into Emerging Market Equities, e.g. as Strategas Asset Management highlights in the chart below.
This raises the question of whether this is too much too fast, or whether the EM rotation trade might be overcooked.
My first thought would be that we should entirely expect to see this sort of dynamic at a true inflection point and trend change. I’d also point out that we care more about flows and sentiment as a contrarian indicator later in an aging and tired uptrend vs at the start of a new bull market.
But the other thing I’d highlight is flows are… the flow, and the stock (allocations) are another thing entirely. If we look at investor allocations to EM equities it’s only just waking up from long-term decline and slumber.
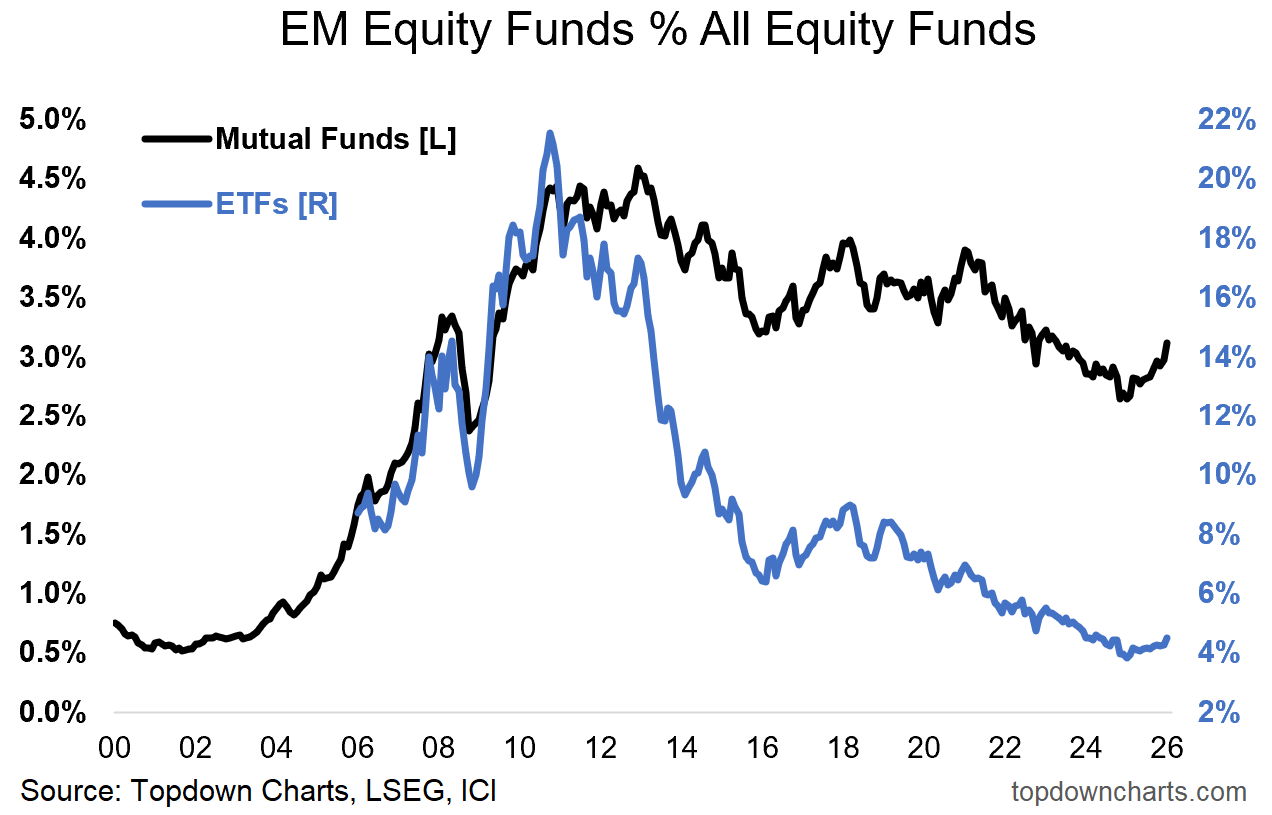
And just look at the numbers: EM equity mutual fund market share is 3% and ETF market share is about 4.5% — that contrasts to EM equities global market cap weight of around 15% (which is tracking below it’s long-term up-trend) and EM economies’ GDP weight north of 50% (and rising).
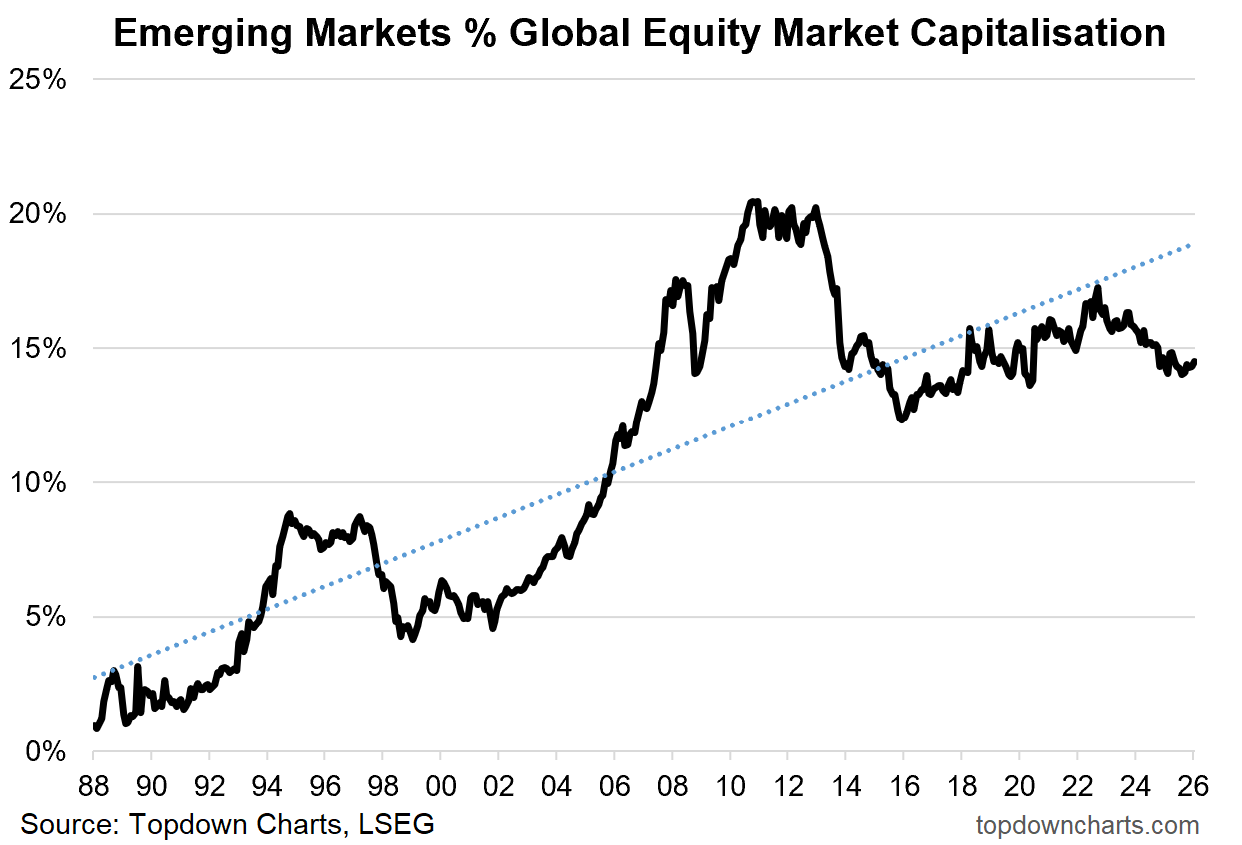
So yes, I would say EM flows and sentiment are getting heated, but actual allocations are just thawing from a deep-freeze ice-age. And if you go off the stats I mentioned above, investors in aggregate are deeply underinvested.
Room to run.
—
Best wishes,
Callum Thomas
Founder & Editor of The Weekly ChartStorm
and Head of Research at Topdown Charts
Twitter/X: https://twitter.com/Callum_Thomas
LinkedIn: https://www.linkedin.com/in/callum-thomas-4990063/
NEW: Other services by Topdown Charts
Topdown Charts Professional —[institutional research service]
Topdown Charts Entry-Level Service —[entry-level version]
Weekly S&P 500 ChartStorm —[US Equities in focus]
Monthly Gold Market Pack —[Gold charts]
thank you Callum, fantastic read as usual
I did track your charts on gold miners almost a year ago and that was just a beautiful signal. And platinum too. Thank you. For EM the charts are surely supported with the weaker USD with energy and mining coming through too or do those things all work together anyway?