
Weekly S&P500 ChartStorm - 1 February 2026
This week: monthly charts, positive January implications, bitcoin rotation, growth/tech risks, value vs growth, drawdown stats, bullish rotations in global equities...

Welcome to the latest Weekly S&P500 #ChartStorm!
Learnings and conclusions from this week’s charts:
Stocks closed up in January (equal-weight beat cap-weight).
A positive January is a positive sign for the rest of the year.
Seeing apparent rotation out of crypto into precious metals.
Also seeing rotation from growth/tech to value/cyclicals.
Signs are it’s a case of “bullish rotation” (broadening bull).
Overall, we’ve managed to get off to a decent start to the year with the gains and bullish rotations of January. There are a few risk spots to keep tabs on (price action in crypto, tech/growth), but the relative strength in some of the more cyclical parts of the market raise the prospect of a bullish broadening…
n.b. see the new and refreshed Subscriber Reviews section (useful if you’re new here or would like to refer a friend; as it gives a good summary of the service).
1. Happy New Month! the (market cap weighted) S&P 500 closed up +1.4% for January, however the equal-weighted S&P 500 gained +3.3% — a reflection of some of the rotation trades in play at the moment. Big picture, the uptrend/bull-market is still well intact.
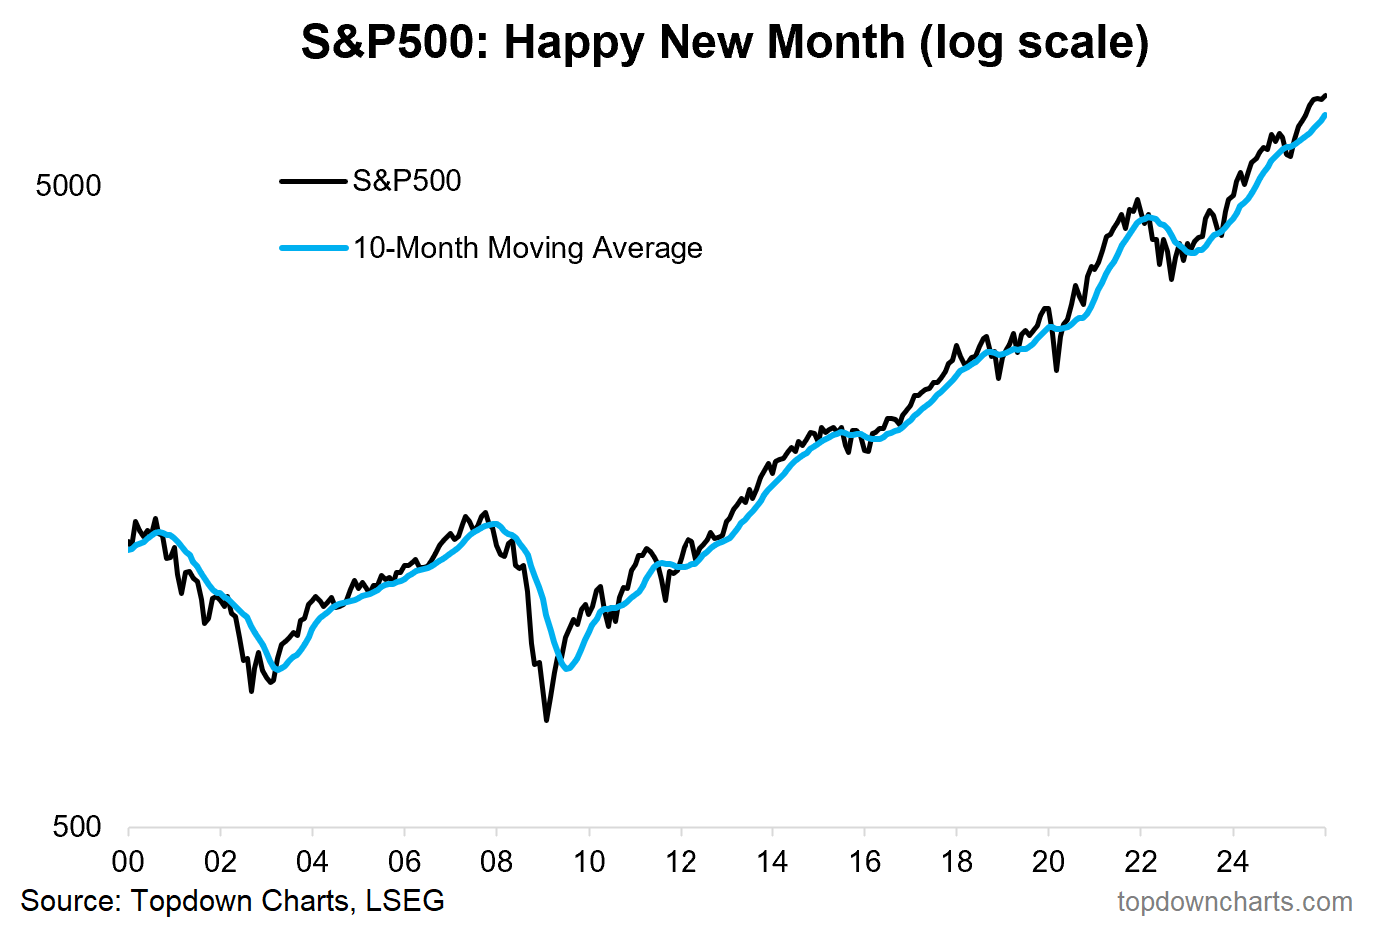
Source: Topdown Charts
2. Up January, Up Year? with the modest gain of +1.4% in January, we now have the “positive January” seasonality curve in play. Historically a positive January has been a positive sign (likely reflecting a combination of momentum effects and the absence of material bad macro news to de-rail things).
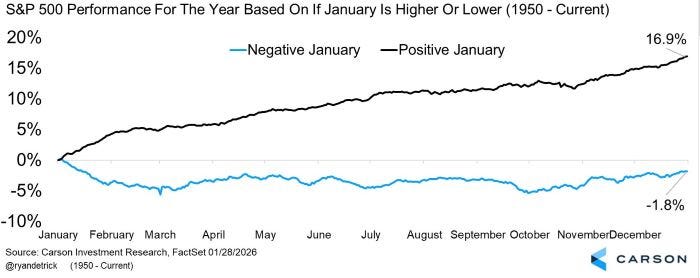
Source: @RyanDetrick via @JasonLeavitt
3. Up-January Detailed Stats: but all good students of the market know that averages can deceive, and that your mileage may vary. The below analysis shows subsequent rest-of-year performance whenever January was an up-month.
Overall the odds are good (average gain of +12.2%, positive 87% of the time), but it should be noted that this rule of thumb failed 13% of the time (a little over 1 in 10 instances were negative). Come to think of it, almost all of those fails involved adverse macro shocks, such as rising rates/bond yields (which is a timely reminder to keep an eye on inflation upside risk this year as the outlook for commodities and the global economy looks up).
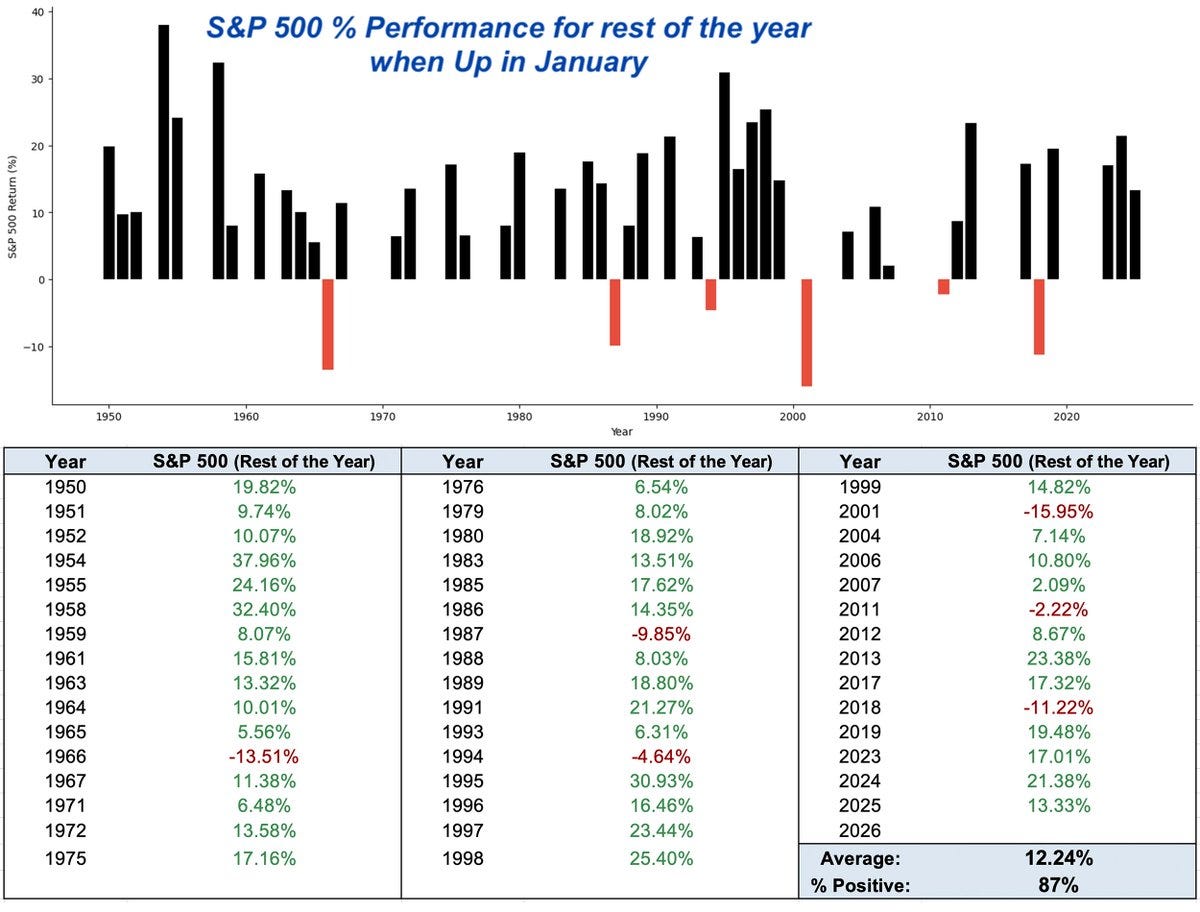
Source: @TheMarketStats
4. Growth & Bitcoin: back on the topic of rotation, this excellent chart illustrates how we appear to be seeing a rotation out of past winners (speculative tech/growth) as traditional cyclicals and commodities are beginning to take the upper hand.
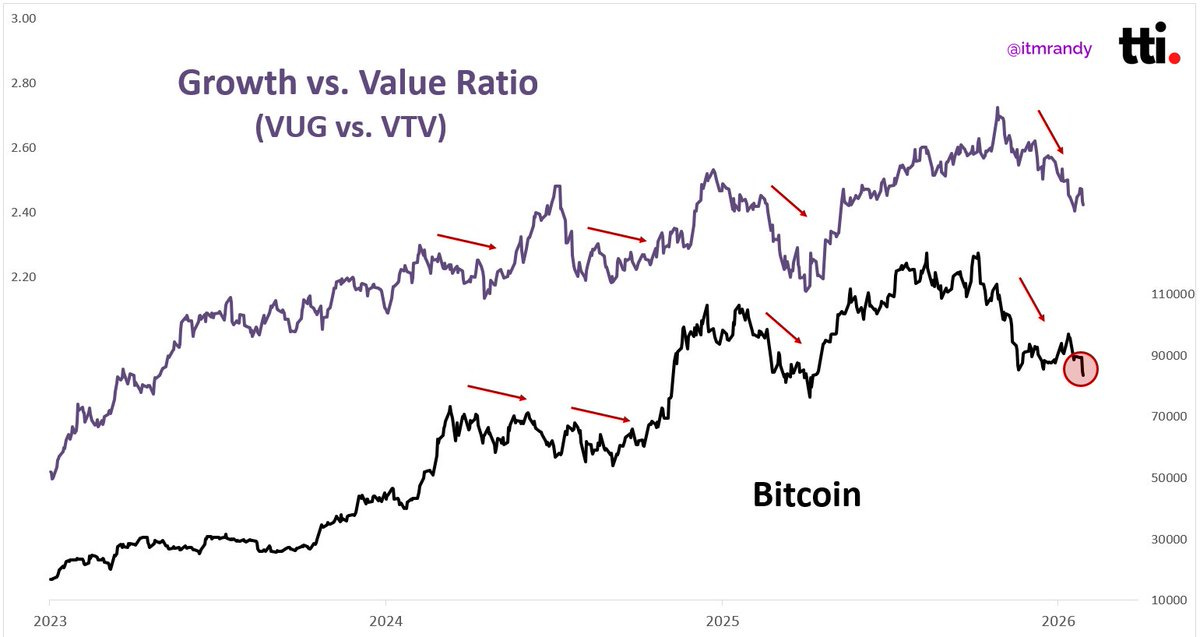
Source: @itmrandy
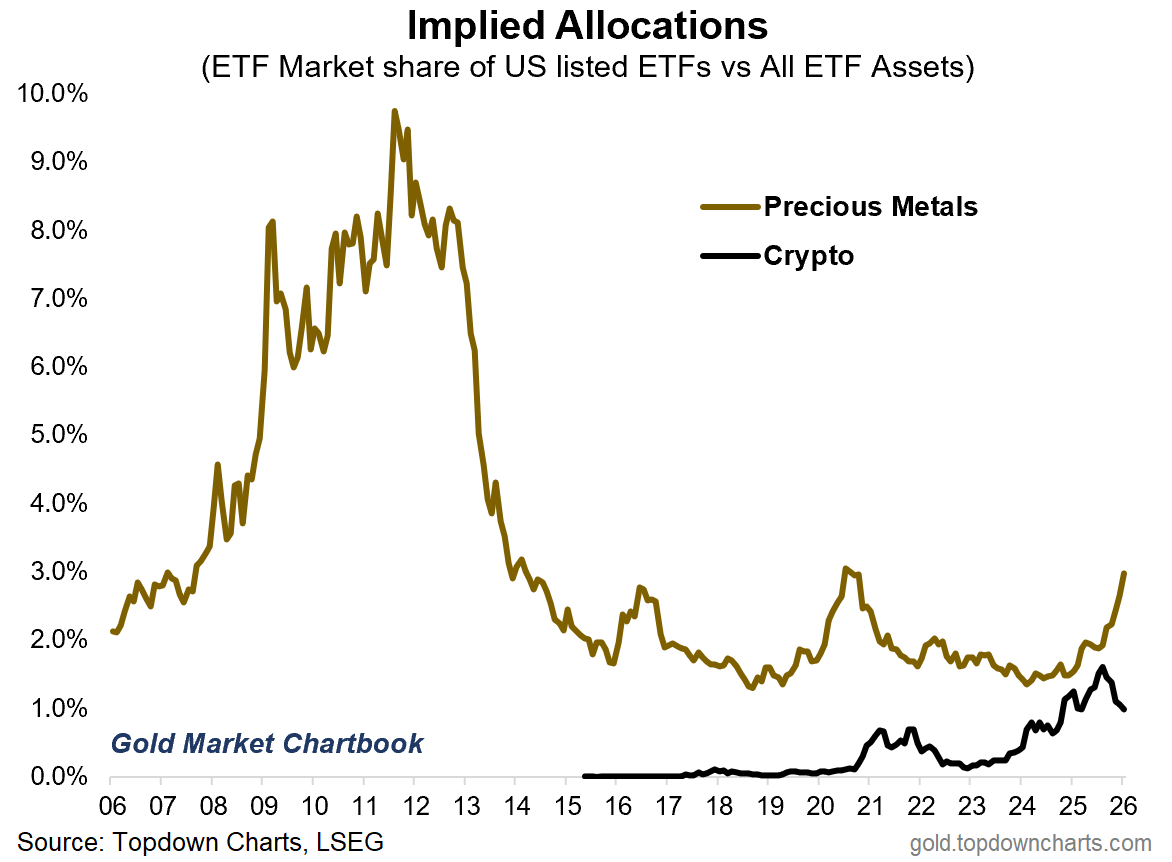
5. Speculative Rotation: but another part of this is precious metals — if you just look at the chart below of implied investor allocations, crypto has tumbled off the highs, and precious metals have surged. And then with Friday’s silver flash crash, it almost seems like the crypto crowd has migrated over to commodity land!
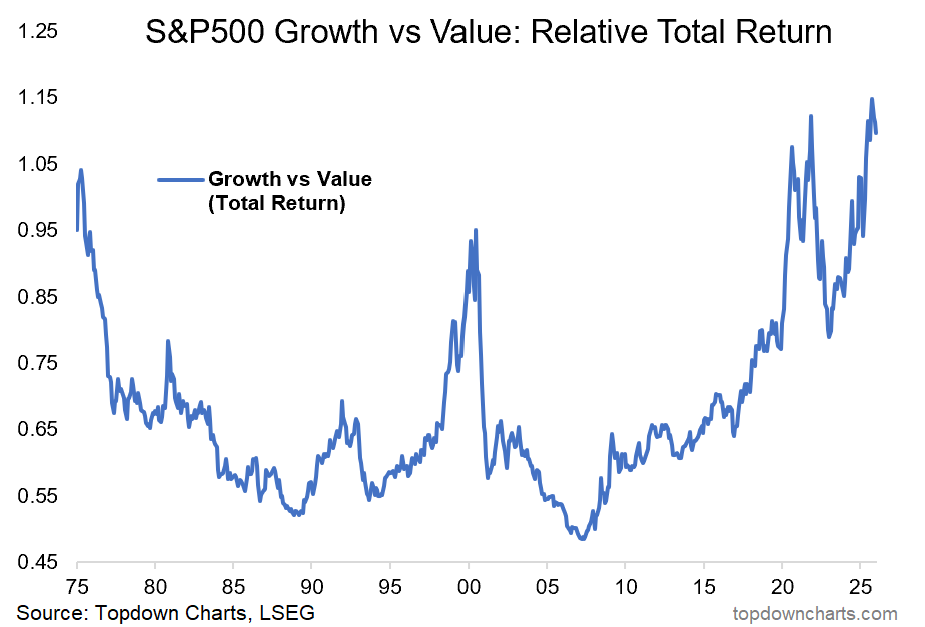
6. Peak Performance — Growth vs Value: back on the growth vs value rotation, I think it’s important to zoom out from that very interesting short-term chart to the equally interesting long-term chart. That looks like a peak and a peak in a series that looks extended from long-term average.
7. Tech-Top: on the growth side of things, the Nasdaq 100 looks like it’s wearing a hat — and the last couple of times it wore a hat, things didn’t turn out too well (late-2021, early-2025). Not only has it stalled at resistance, but we can factually say that the Nasdaq peaked months ago (no new high yet), and over 40% of the index are tracking below their 200-day moving averages — so growth/tech is on-notice here.
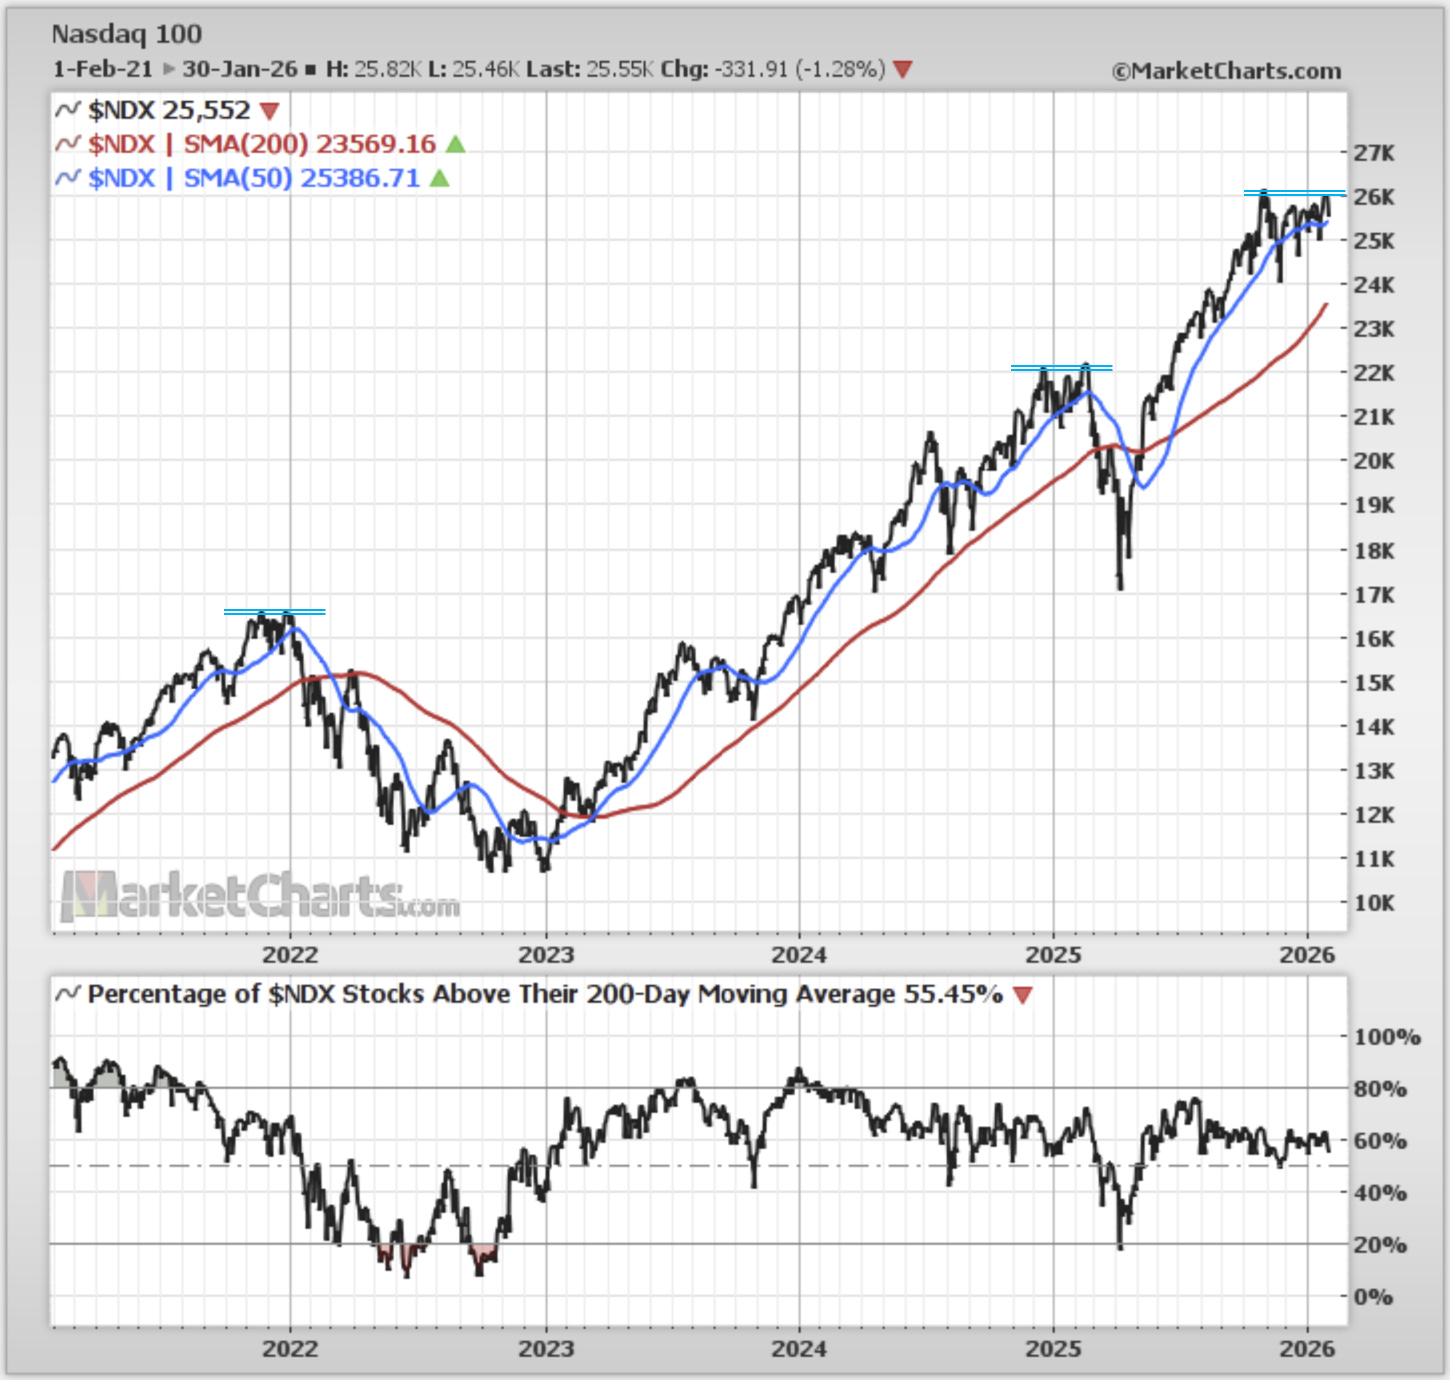
Source: MarketCharts.com
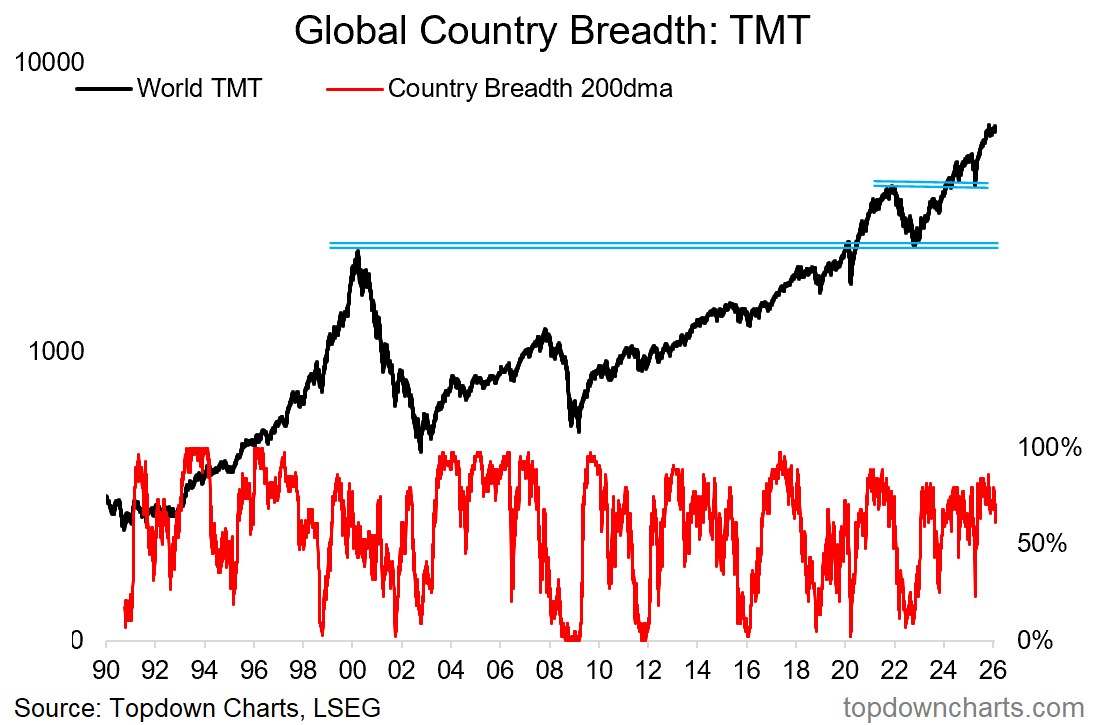
8. Global Tech Stocks: similarly, if we look at global tech (TMT = Technology, Media, Telecommunications — a more broader definition of tech that brings back in some of the stocks that have been reclassified out of the GICS tech sector over time) —— the global tech index has likewise stalled and 200-day moving average country breadth has rolled over from the highs (a warning sign).
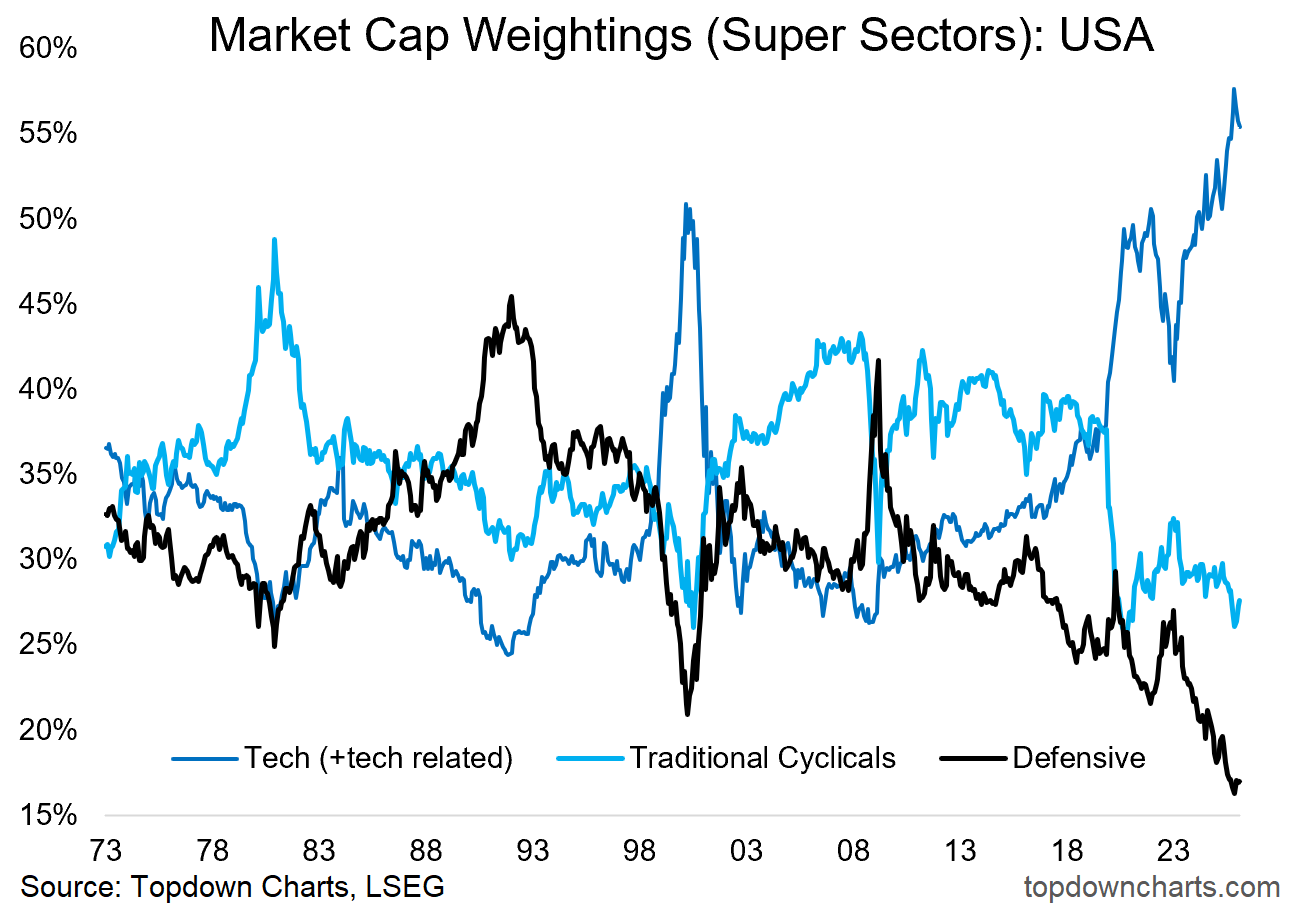
9. Tech & the Rest: meanwhile back on the US tech sector, this stall and peak in tech + peak in growth vs value comes as tech’s market cap weighting peaked at a record high (meanwhile defensives are tentatively basing around record lows, and more importantly — traditional cyclicals turning up from 2020-lows).
Traditional cyclicals (industrials, financials, energy, materials) are more directly geared to global growth reacceleration and commodities, so we could easily be witnessing the initial phases of a bullish rotation (e.g. where you might see tech plateau and range, while cyclicals surge and the bull market simply broadens out vs breaks).
10. Drawdown Probabilities: but on the topic of breaks, the last chart here is an interesting and useful perspective-builder on the frequency of differing levels of drawdowns. Basically most investors will see many 10-20% corrections, and at least a few larger drops in their lifetimes. Which is a reminder to have a plan, process, and psychology to navigate through the noise and larger cycles and shifts.
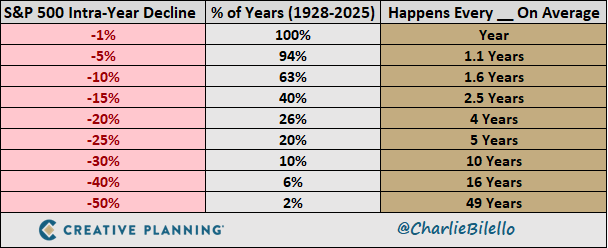
Source: @charliebilello via @PeterMallouk
Thanks for reading, I appreciate your support!
Portfolio Strategy Notes — Global/Small/Value
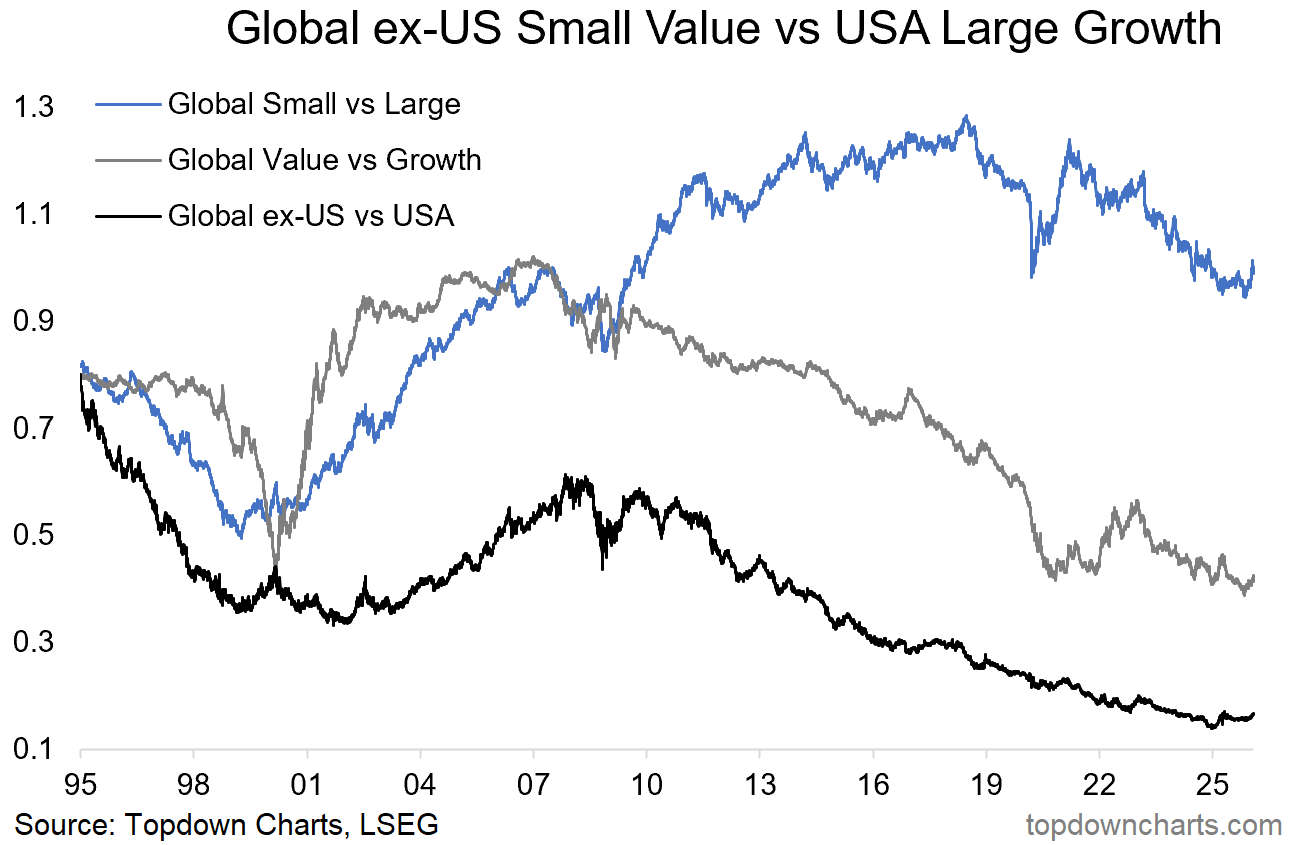
On the topic of rotation, I thought it would be good to share a couple of charts from my latest Topdown Charts institutional weekly report — they focus on the “Global Equities Relative Value Trinity” of small vs large, value vs growth, and global vs USA. As you can see all 3 are currently making an effort at turning the corner after an extended period of underperformance.
The reason we’re interested in these what have been uninteresting and uninspiring parts of of the market is how extreme and historically stretched the relative value indicators are for all 3 of these pairs:
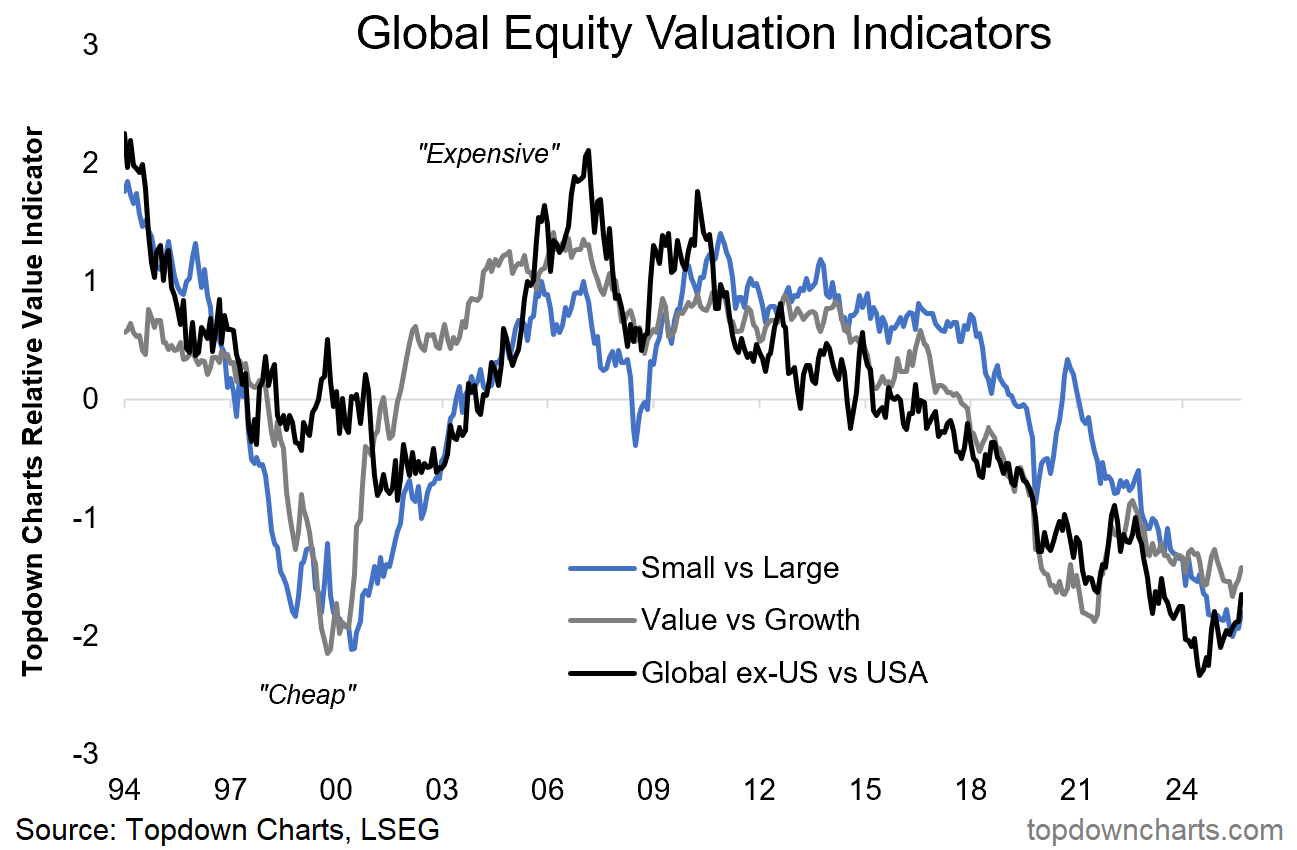
But here’s an especially intriguing angle to it — the absolute value indicator for the combined US/Large/Growth has peaked and at least for now plateaued, meanwhile the black line is playing catch-up (Global/Small/Value). This is what we call “Bullish Rotation” — where the laggard catches up to close the gap… as opposed to Bearish Rotation, which would be where the previous leader catches down.
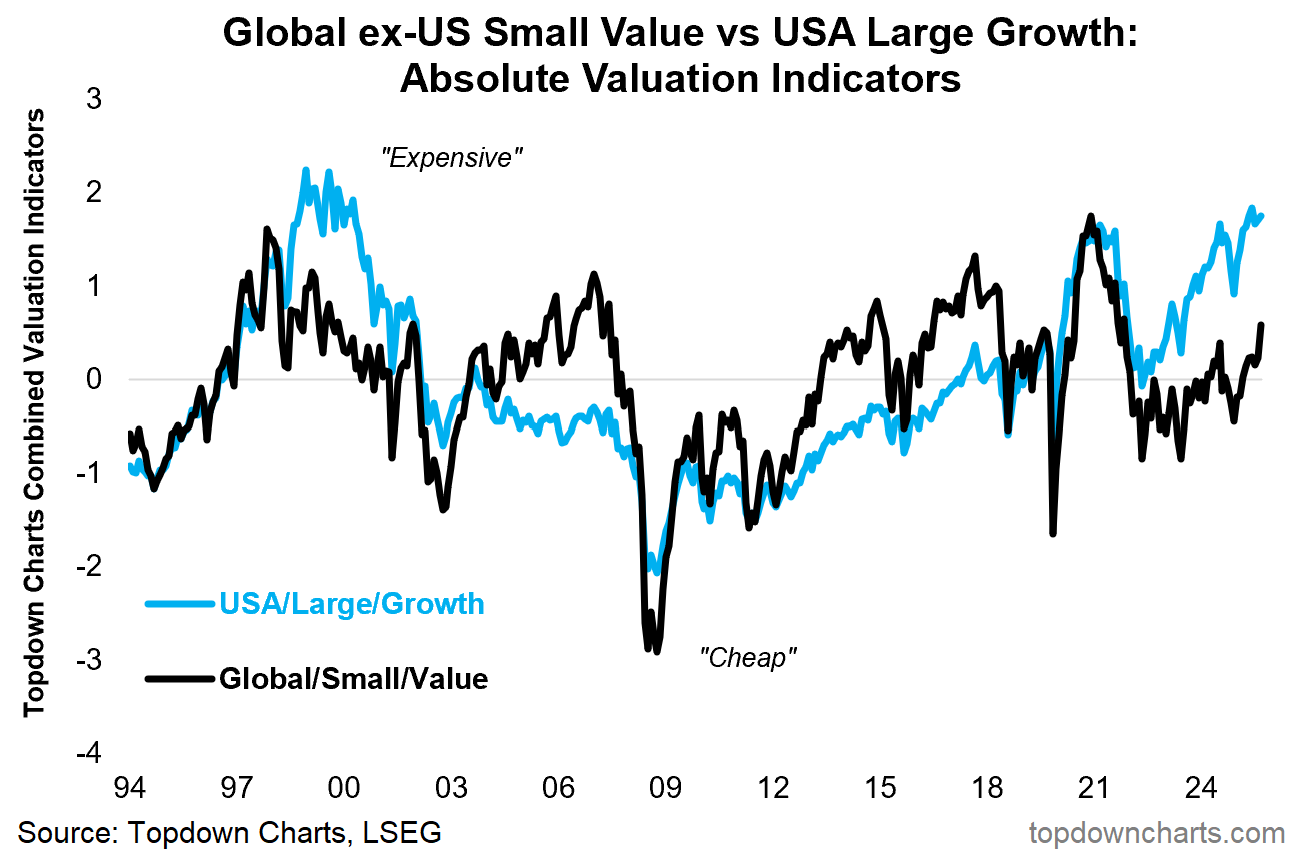
While it is early days in the move, due to the extremes on display and the prospect of this being a virtuous bullish rotation — this is a highly significant (bullish) development for the global equity bull market in general, but also for upside in some of the previously overlooked and undervalued parts of the market.
—
Best wishes,
Callum Thomas
Founder & Editor of The Weekly ChartStorm
and Head of Research at Topdown Charts
Twitter/X: https://twitter.com/Callum_Thomas
LinkedIn: https://www.linkedin.com/in/callum-thomas-4990063/
NEW: Other services by Topdown Charts
Topdown Charts Professional —[institutional research service]
Topdown Charts Entry-Level Service —[entry-level version]
Weekly S&P 500 ChartStorm —[US Equities in focus]
Monthly Gold Market Pack —[Gold charts]
That #10 on Drawdown Probabilities is fascinating, thank you for sharing!
At least 15% on 40% of years calls for some clever use of put options when well-priced ... the 15% drawdown takes the intra-year max as reference point, correct? (not Jan 1st)
Insightful as always Callum (I know I say this every week but I appreciate how consistently good your charts + commentary have been!) A couple of points
- Re: rotation into value: We certainly saw signs of this at play with US consumer staples stock prices moving off their lows.
- Re: tech topping: Yep, another guy I subscribed to, Data-Driven Investor, came to the same conclusion too.
- Re: speculative rotation: That's really interesting. I heard someone in one of the investor communities said recently that he saw a bunch of crypto bro tweets re: going into silver... that might explain the outsized drawdown in precious metals on Friday. Though, with any bull market, there will be a few decent corrections (as you wisely noted - have a plan for drawdowns!)