Weekly S&P500 ChartStorm - 6 August 2023
This week: AAPL, market technicals, seasonality, flows, credit tightening, monetary tightening, risk premia, payout ratios, corporate longevity, and rebullding sentiment...
Welcome to the latest Weekly S&P500 #ChartStorm!
Learnings and conclusions from this week’s charts:
The biggest of big tech is causing big trouble for the market.
But beyond big tech, breadth is weak; which along with poor seasonality suggests caution and patience as the selloff runs its course.
Credit tightening continues as banks exercise caution on lending.
The long and variable lags of monetary tightening are likely longer for US corporates as almost 80% of borrowings are on long-term fixed rates.
Stats show public companies have a half-life of about 10 years.
Overall, the somewhat reluctant migration of bears to bulls appears to have reached a ceiling in the short-term as negative seasonality weighs-in with a laundry list of excuses for selling. Summer better spent elsewhere?
Recommended Newsletter Spotlight… Another great chart resource: sign up for the (free) Daily Shot Brief — Global Macro Currents, Visualized.
1. Apples to Apples: Despite beating estimates on earnings & sales for Q2, AAPL 0.00%↑ reported a further decline in sales, and warned of a potential 4th decline in a row to come in Q3. Hence the stock, which had a peak market cap weighting in the S&P 500 of 8.2% (!) at the end of June, summarily plunged, and now casts a bit of a shadow over the do-no-wrong Big Tech stocks. The chart below shows the technician’s perspective, with the stock breaking a key trendline (albeit another perspective is that it just testing support of the previous all-time highs).
Source: @JaguarAnalytics + see also @AlfCharts
2. Bigger Than Big Tech: Looking at some of the breadth indicators (e.g. the chart below showing the prevalence of MACD technical sell signals), the selloff that kicked off last week could still have a way to go.
Source: @MacroCharts
3. Seasonally Sh… Indeed, this time of the year (as I have previously pointed out) tends to feature higher volatility and a generally bearish tone from a seasonality and cycles perspective. Maybe the market just needed a breather after such a blistering run and flip from consensus bears to bulls with overbought conditions (and you know at that point any excuse will do for a selloff).
Source: @allstarcharts
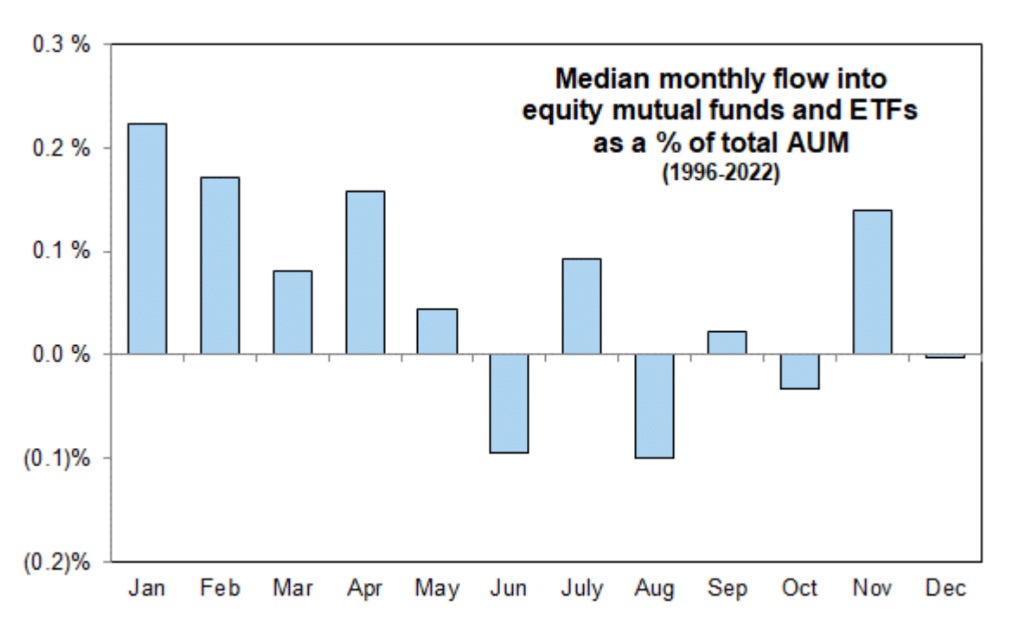
4. Seasonal Flows: Another angle on seasonality, this time of the year tends to see net OUT flows from equity mutual funds and ETFs. So that reinforces the seasonal price patterns (maybe people either raising funds for summer holidays, or reducing exposure so they can focus on the beach!).
Source: Daily Chartbook
5. Credit Tightening: The past week or so had a laundry list of excuses to sell (e.g. AAPL earnings, Fitch US sovereign credit downgrade, rising bond yields, etc) …but another somewhat more obscure one was the Fed loan officer survey — which showed further net-tightening of credit criteria by lending decision makers. As rates rise the cost of funding goes up and as it seems the difficulty of obtaining funding is now also going up as bankers take a more cautious approach given the murky macro.
Source: Chart Of The Day - Credit Tightening Topdown Charts
6. Cash or Stocks? The rate of return on cash securities now beats the earnings yield on stocks. At this point you have to believe that capital gains and growth will do enough heavy lifting to beat the effortless and smooth sailing returns of cash. And that’s at a time where the outlook is murky and valuations are back to expensive.


