
Weekly S&P500 ChartStorm - 23 July 2023
This week: bear extinction, Nasdaq technicals, Big Tech big test, VIX seasonality, market of stocks, bond market signals, corporate interest expense, intangibles, bull market signals...

Welcome to the latest Weekly S&P500 #ChartStorm!
Learnings and conclusions from this week’s charts:
Bears have disappeared: 3 sigma drop in bearish survey responses.
Nasdaq technicals give hints of prospective further (significant) upside, however in the immediate-term big tech faces a big test.
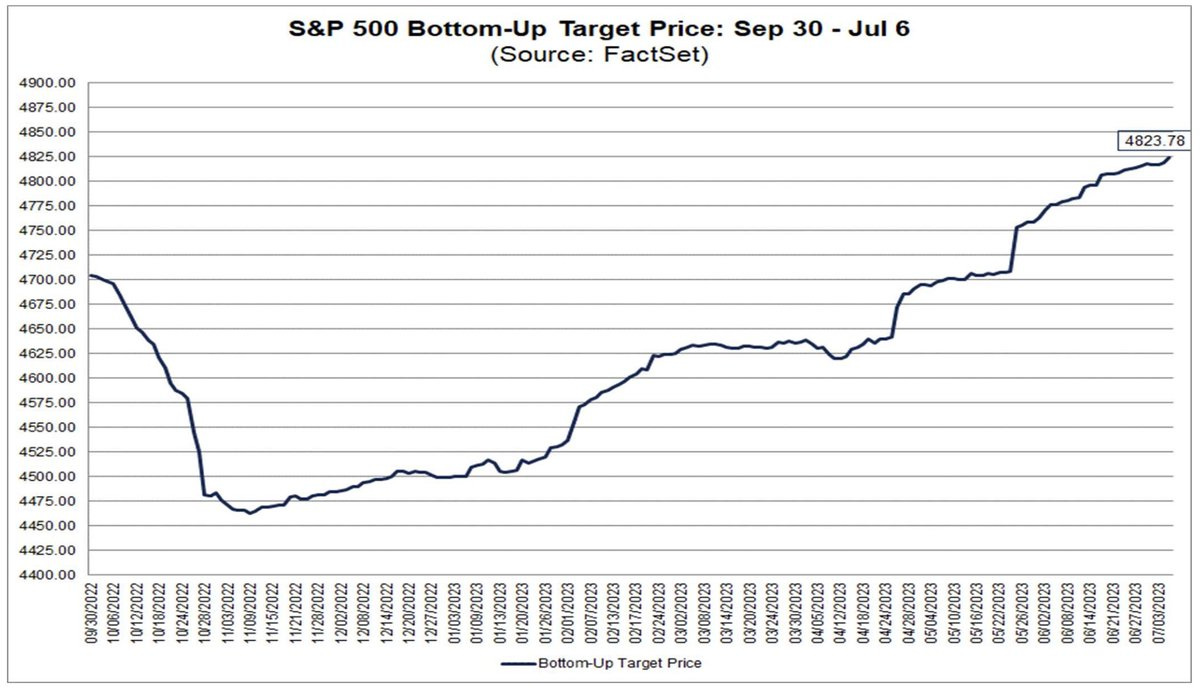
Wall Street strategists see the stock market falling to 4100 by year-end, while analysts see the “market of stocks” rising to 4800.
The high yield bond market appears to be giving stock market strength the thumbs up (but yet, bankruptcies are on the rise).
Two longer-term indicators are signaling the start of a cyclical bull market.
Overall, it’s getting easier and easier to find (technical) bullish evidence, and this is driving a self-reinforcing rise in the market as sentiment shifts from extreme bearish to increasingly extreme bullish. But yet questions remain on the macro, and a few key technical tests lie ahead…
Recommended Newsletter Spotlight: The Daily Shot
Sign up for the Daily Shot Brief — Global Macro Currents, Visualized.
The Daily Shot is one of my long-standing personal favorite sources of interesting macro & market charts, and really one of the OG fintwit newsletters — be sure to check it out and subscribe (free)
1. Mass Extinction: The run-up in stocks since the October low amounts to an extinction-level event for bears. There has been almost a 3 standard deviation move in bearish responses to the AAII + II surveys from one of the highest readings on record last year to now the lowest since the heights of the pandemic liquidity frenzy.

Source: @topdowncharts Topdown Charts Professional
2. Nasdaq Underachieving? Despite the already blistering run in tech stocks, the Nasdaq appears to be underperforming its typical bear market recovery trajectory.

Source: @SoberLook >>> SUBSCRIBE to Daily Shot Brief for [free] daily updates
3. Nasdaq in 2023 vs 2003: This interesting set of technical analysis maps out the path of the Nasdaq as it made it’s major multi-year bottom in 2003, and how at least on the technicals it parallels to today’s market. Which, along with the previous chart, would be particularly interesting for bulls.
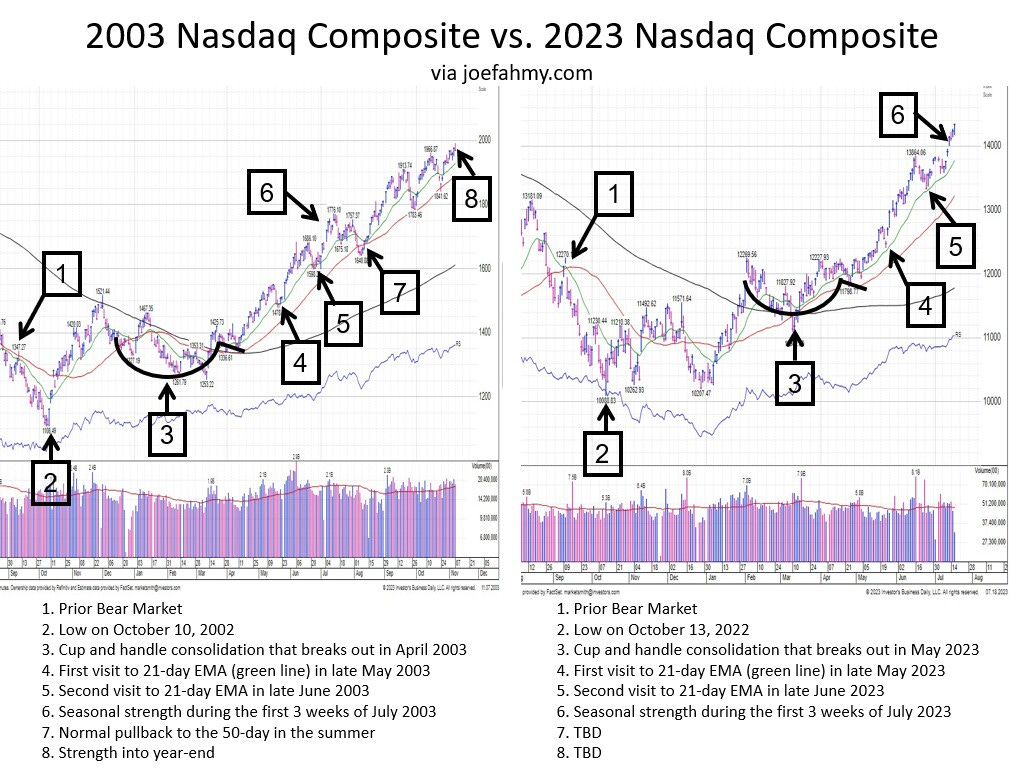
Source: @jfahmy
4. Not So Fast: This chart (which for context, was half in jest), highlights how it may not be as simple as that. The main driver of strength for the stock market in 2023 — Big Tech — now faces a Big Test. A major overhead resistance line looms, the RSI is ticking lower from overbought levels, and the Big Tech vs S&P500 relative performance line is stalling at resistance. And this comes just as we’re entering into a historically patchy patch of the year.

Source: @HostileCharts
5. 'Tis the Season to be Volly: Indeed, the seasonal tendency is for higher volatility around this time of the year; climaxing around October. With sentiment increasingly frothy, valuations back to expensive levels, and still murky macro, the path higher may not be as smooth or simple as it seems.

Source: @topdowncharts Topdown Charts
6. Market of Stocks: While Wall Street strategists see the stock market falling to about 4100 by year-end, Wall Street analysts see the “market of stocks” rising to 4800.
Source: @SamRo
7. High Yield Highs: High yield bond market breadth is pushing higher after a catastrophic 2022. While this includes information from the credit side of things (risk of default), it also includes duration information (interest rate level). Since both credit risk and interest rate levels both affect the stock market, it’s an interesting indicator, and arguably the bond market is giving stock market strength the thumbs up here.
