
Off-Topic ChartStorm - US Treasuries
Taking stock of US treasuries: the bear market, the bullish setup, global perspectives, and longer-term historical insight...

Here’s a quick Fixed Income “Off-Topic ChartStorm” with a focus on treasuries.
Unlike the usual weekly ChartStorm (which focuses on the S&P500 and related issues), the Off-Topic ChartStorm is a semi-regular focus piece with topics spanning macro, markets, stocks, commodities, regions/countries, and various other issues of interest.
Learnings and conclusions from this session:
Bonds remain in a bear market (having peaked in 2020).
Sentiment/positioning remains consensus bearish on bonds.
Yet, treasuries look cheap and technicals are tentatively turning.
Higher-for-longer risk remains front of mind (especially globally).
History suggests long-term cycles in yields (but cycle compression?).
Overall, it’s clear the bond bear market has laid lasting damage to sentiment on bonds. Arguably this has helped created a bullish contrarian setup in waiting. But historical and global perspective suggests some caution, and we await price and macro confirmation as upside catalysts for the bond bull breakout…
1. The Great 2020’s Bond Bear Market: Adjusting for inflation and including interest reinvested, the popular long-term US treasuries ETF [TLT] is basically still in a bear market (having peaked in 2020). It’s also been dead money for those who bought and held 20 years ago. But as all good things come to an end; all bad things likewise come to an end too — so it raises a question: when will the bond bear market end?
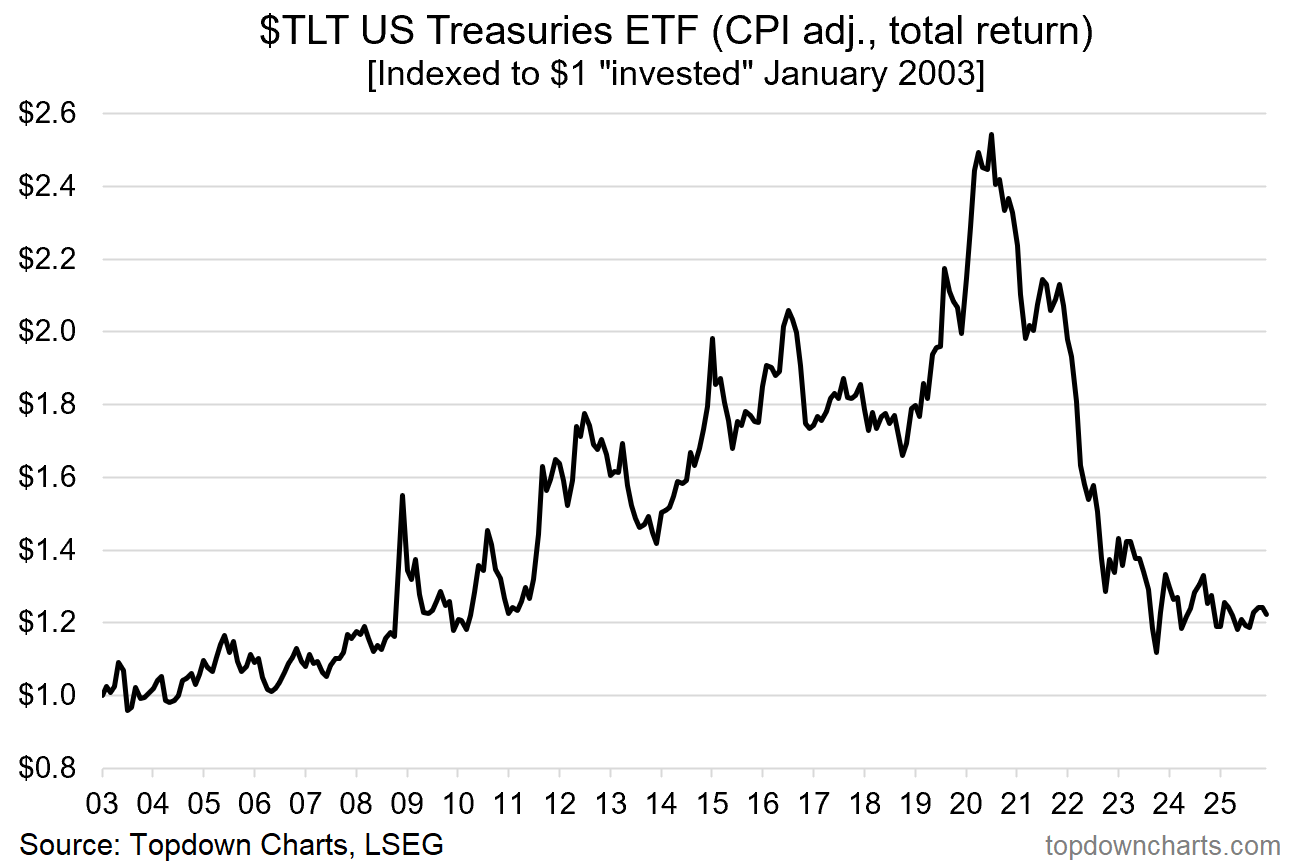
Source: Topdown Charts Research
2. Bonds Basing? It’s a question many are pondering, and while TLT is still basically in bear market, we’re also seeing a clear basing process in progress.

Source: @Mr_Derivatives
3. Heavy Shorts: Meanwhile, shorts are piling up. While some of this may be linked with derivatives arbitrage, it is actually consistent with a lot of other sentiment data I’ve seen — and I would confidently say the consensus is still bearish on bonds.

Source: @SubuTrade
4. Light Allocations: Another key positioning datapoint is the combined asset allocation indicator below (uses data from AAII survey, ICI fund data, and Fed financial system stats), which shows individual investor bond allocations are sitting at 18-year lows. Investors hate bonds.
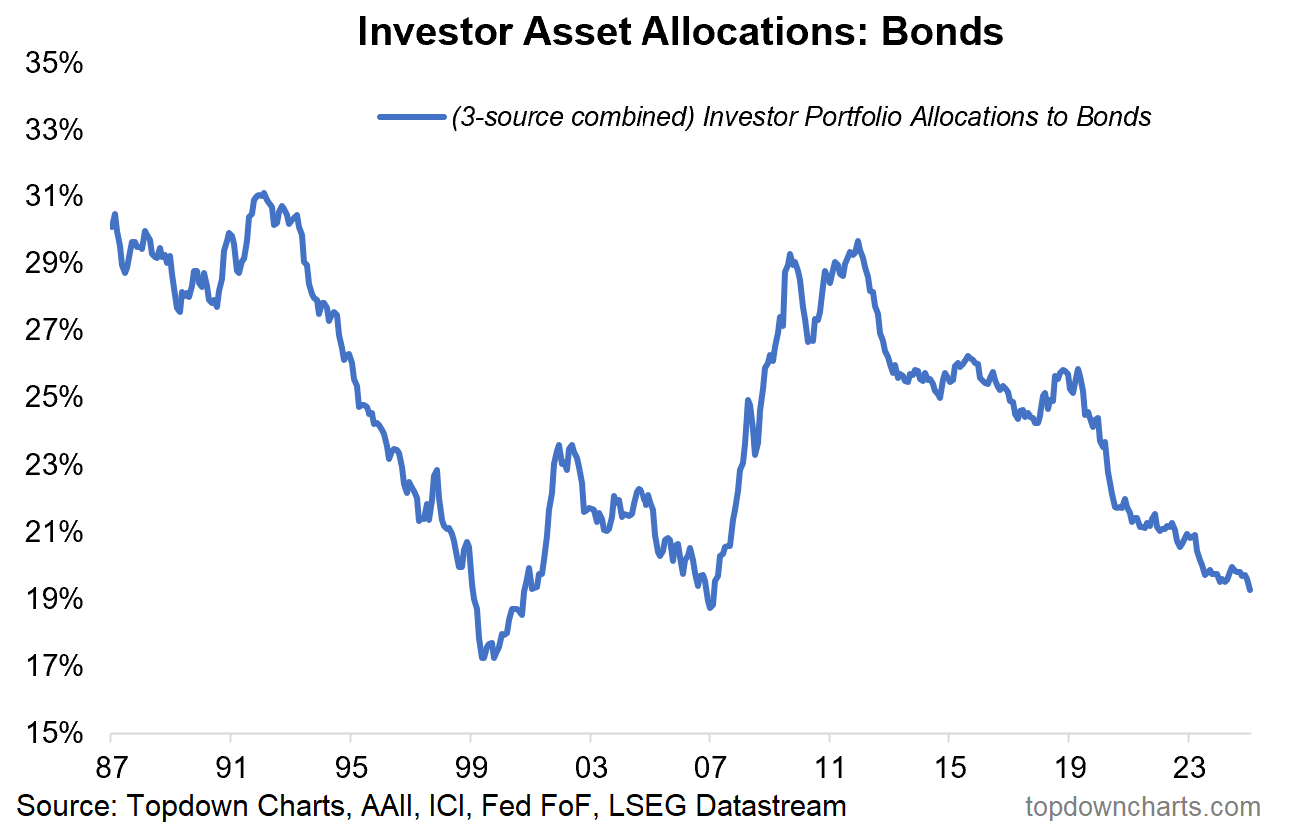
Source: Chart of the Week - Bond Allocations
5. Consensus = Range-Trade for Longer: And another somewhat related datapoint here shows that fund managers are basically expecting US 10-year treasury yields to stay stuck in the range (consensus 68% sees US 10yr yields between 3.5-4.5% by year-end 2026). A very small minority see bond yields breaking lower (11%) while 20% say higher than 4.5% — so basically a consensus of neutral-to-slightly-bearish on bonds.

Source: @MRBullMktEver
6. Treasuries Valuation Indicator: Meanwhile, my valuation indicator for US treasuries (in the 10-year maturity range) is ticking up from cheap levels — and the 10-year treasuries price index is ticking up from a logical support area. So I think there is cause to keep treasuries on the watch-list, and to begin scaling up exposure (particularly as stocks look increasingly expensive, and the economy softens).
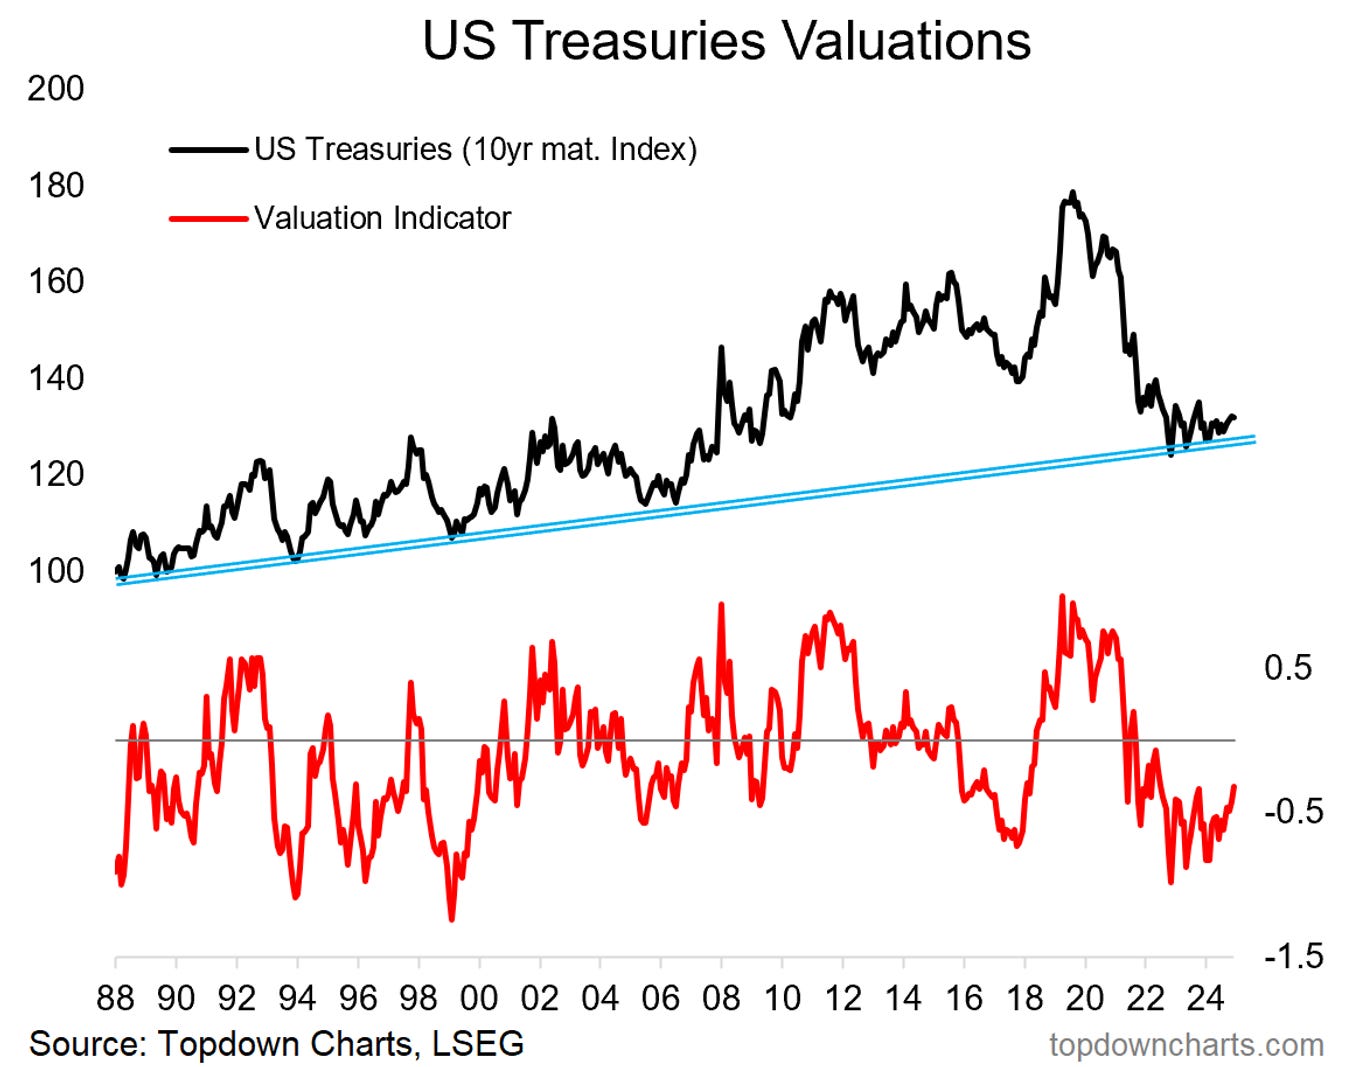
Source: 2026 Outlook Webinar Replay (+Slide Pack)
7. Global Long-Term Government Bond Yields: But because it’s never that simple, here’s one curveball to throw into the mix — if you look at developed markets long-term sovereign bond yields it’s a fairly clear picture of an uptrend (which p.s., is bearish for bond prices).

Source: @JasonP138
8. Higher For Longer? For those wondering why bond yields have moved higher, a big part of it has to do with this chart. The long-term nominal rate of economic growth made a step change following 2020. Ultimately bond yields reflect the state of growth and inflation, so unless we get a recession or shock which drives growth/inflation lower, then it could well be that we see bond yields linger higher for longer.
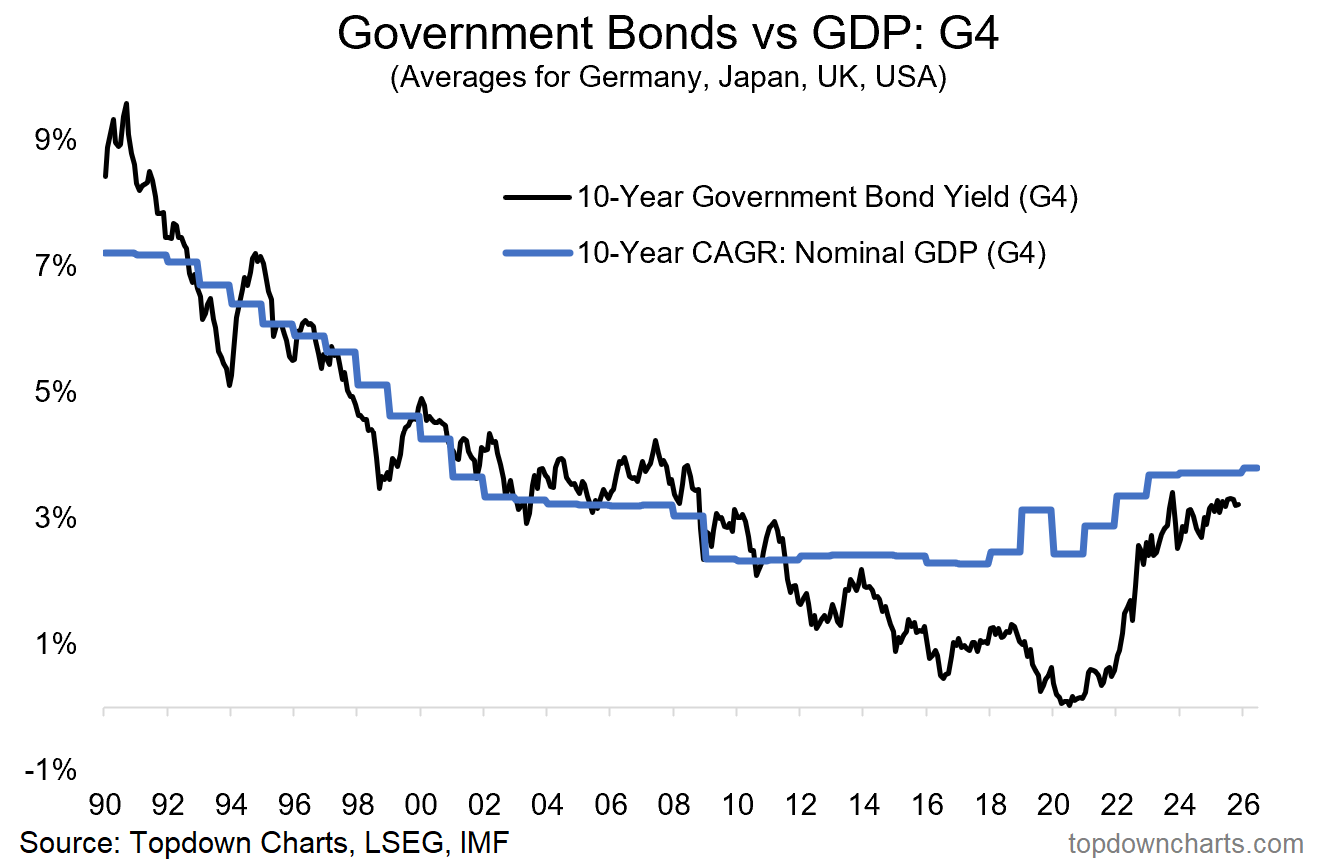
Source: Topdown Charts Professional
9. Long-term Perspective on Interest Rates: Zooming out, here’s a very long-term view of interest rates. Some would argue that there will be a period of payback for the zero-interest rate policy era, and that higher-for-longer is logical and historically normal.

Source: @MikeZaccardi
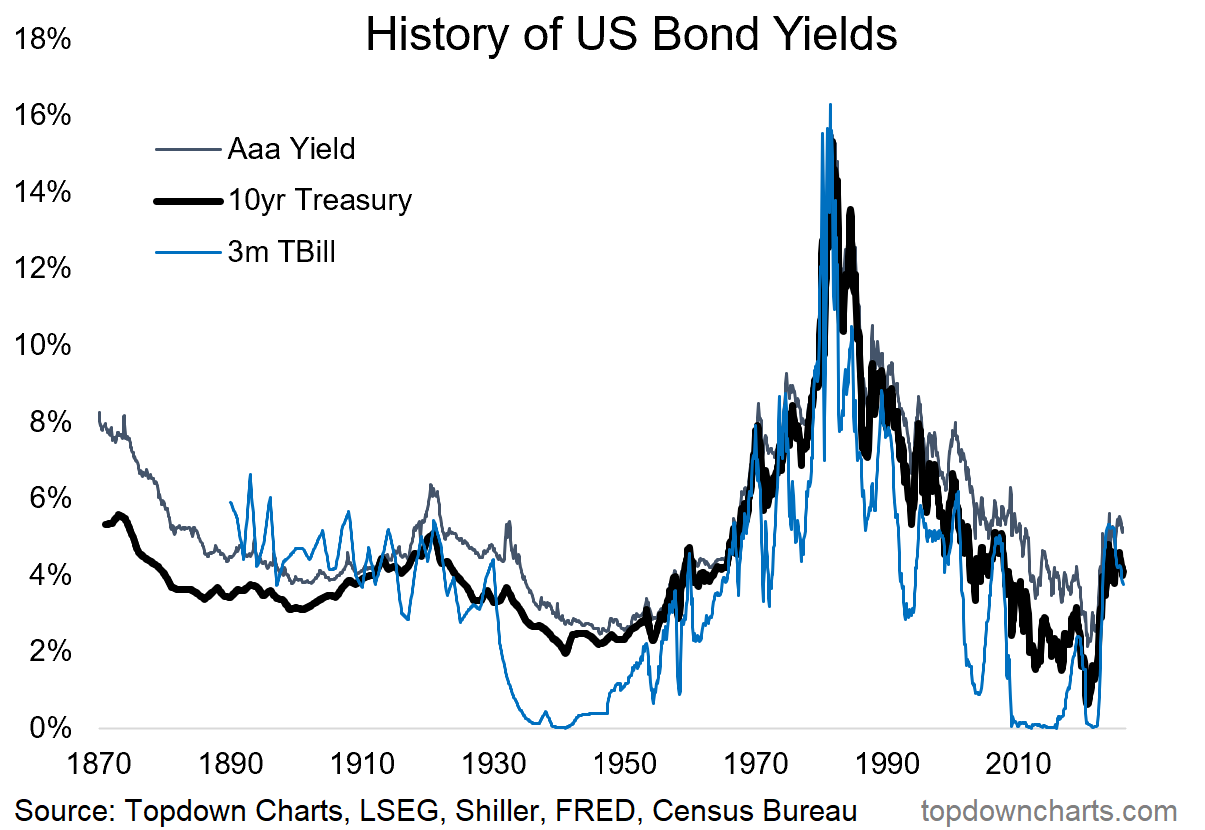
10. US Interest Rates History: Meanwhile here’s the long-term US picture for short-term rates, US 10-year treasury yields, and corporate bond yields. You could also make a case for long-term up/down cycles here too.
As a random reflection though, one interesting possibility would be a compression of cycles as things accelerate on multiple fronts (tech development, geopolitical tensions, demographics, debt, etc). In that sense you might argue that the up-phase in yields has been rapid and a down phase will come sooner and sharper than in the past due to cycle-compression.
In the meantime though, keep watching the charts — price will tell us when things are about to get moving for bonds, and macro will confirm…
Source: Topdown Charts
Thanks for following, I appreciate your interest!
p.s. Let me know if you found this useful — would you like to receive more updates like this? I am thinking about doing an (almost)fortnightly or at least monthly ChartStorm on Fixed Income [treasuries, corporate bonds, interest rates, private credit, etc] as a regular feature…
—
Best wishes,
Callum Thomas
Founder & Editor of The Weekly ChartStorm
and Head of Research at Topdown Charts
Twitter/X: https://twitter.com/Callum_Thomas
LinkedIn: https://www.linkedin.com/in/callum-thomas-4990063/
Other services by Topdown Charts
Topdown Charts Professional —[institutional macro/multi-asset research]
Topdown Charts Entry-Level Service —[entry-level version of the above]
Weekly S&P 500 ChartStorm —[US Equities in focus]
Monthly Gold Market Pack —[Gold charts]
Australian Market Valuation Book —[Aussie markets]
If one believes in AI, should one also buy a long bond to maturity? AI = automation = loss of jobs = recession/deflation = return of ZIRP?
Very informative post. Thanks