
Chart of the Week - Semiconductor Surge
Chart in-focus from the latest Weekly S&P500 ChartStorm

Note: this is a new series for free subscribers and is intended to give an insight into the work that goes into The Weekly ChartStorm + provide a little further explanation on charts and concepts.
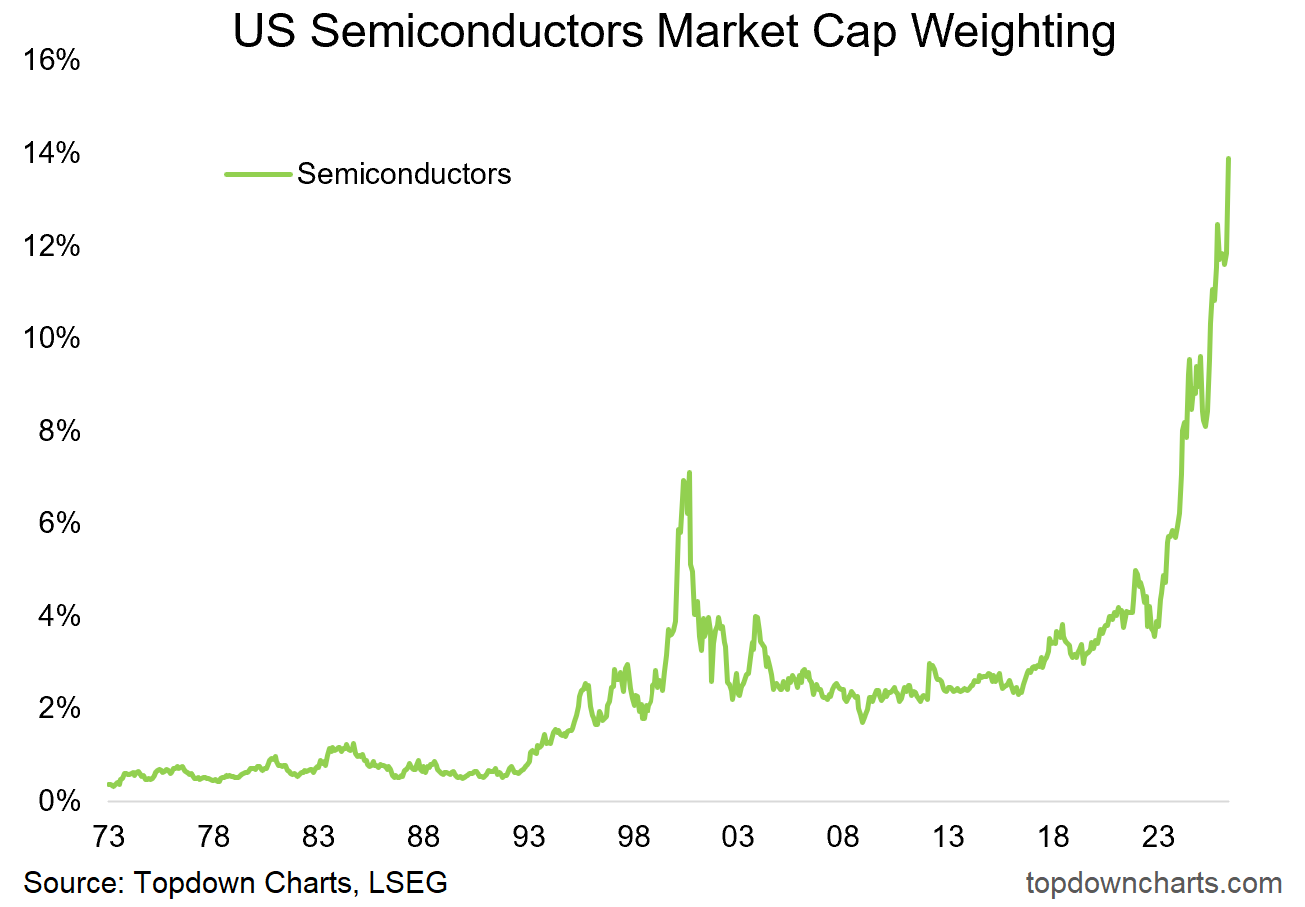
This week’s chart shows the market cap weighting of US semiconductor stocks (making record highs).
It’s a remarkable chart because at ~14% it’s basically double the level it peaked at during the height of the dot-com bubble.
It also comes at an interesting juncture as the SOX (Semiconductors Index) just chalked-up a record 17-days in a row of gains.
This is a dangerous market.
It’s dangerous for bulls because these are the types of conditions where you often encounter sharp corrections and crashes (even if it is the way of the future).
But it’s also dangerous for bears because this is basically the bubble-phase of the bull market — attempts at shorting could end up generating large losses in small time as a combination of greed, speculation, and fundamentals could drive semis even higher.
On that last point, students of market history know that booms, bulls, and bubbles start for a reason and end when things get unreasonable.
While bulls and bears often get taken by surprise in these types of markets, all my years in studying charts and observing market cycles tells me that there are always clues on the next steps for those willing to see.
And I’ll be bringing you more of these clues and views in the next Weekly ChartStorm, so stay tuned for more insights…
Bottom line: semiconductors are in the bubble phase of the bull market (which is dangerous for both bulls and bears alike!).
Thanks for reading!
For more info on the Weekly ChartStorm service see:
Lastly, be sure to reach out at any time if I can help with anything. I promise to leave no questions unanswered and no problems unsolved.
—
Best wishes,
Callum Thomas
Founder & Editor of The Weekly ChartStorm
and Head of Research at Topdown Charts
Twitter/X: https://twitter.com/Callum_Thomas
LinkedIn: https://www.linkedin.com/in/callum-thomas-4990063/
Already a paid subscriber?
Log-in and read the latest report here:

.
Peter Boockvar makes a good point that this Semi demand is driven by over ordering in fear of Hormuz halting chip production.
https://youtu.be/DpnSpkETkX4?si=abXeoV-B2JmXVm1a