
Weekly S&P500 ChartStorm - 26 April 2026
This week: technical check, seasonality snippets, fund flows, semiconductors, market froth at the top, cyclicals, global growth, emerging market equities...

Welcome to the latest Weekly S&P500 #ChartStorm!
Learnings and conclusions from this week’s charts:
There’s a minor bearish breadth divergence on the S&P500.
Seasonality is also moving into a weaker period.
(albeit seasonality tends to be better when stocks are up YTD)
Semis are surging, chalking up multiple records and extremes.
Cyclicals vs defensives are confirming the bullish macro picture.
Overall, there’s a couple of short-term technical risk flags to note (especially with geopolitics simmering and central banks in the wings) and plenty of pockets of froth still bubbling away in markets. But there’s also some bright spots (e.g. emerging markets, cyclicals vs defensives, buoyant global economy).
1. Bearish Divergence? not to spoil the rebound party, but it’d be remiss of me not to flag this obscure technical pattern. While the index managed to chalk up new highs, breadth has rolled over from a lower high. This is a classic bearish divergence.
Now, bearish divergences don’t always work —but they do highlight that there are some quibbles and irritation under the surface. The other thing is excuses/events have a habit of popping up when the market is “ready” …which is interesting because we have ongoing geopolitical issues, and a whole line-up of big central banks meeting next week, including the Fed (will anyone hike rates to stave off emerging inflation risk?).
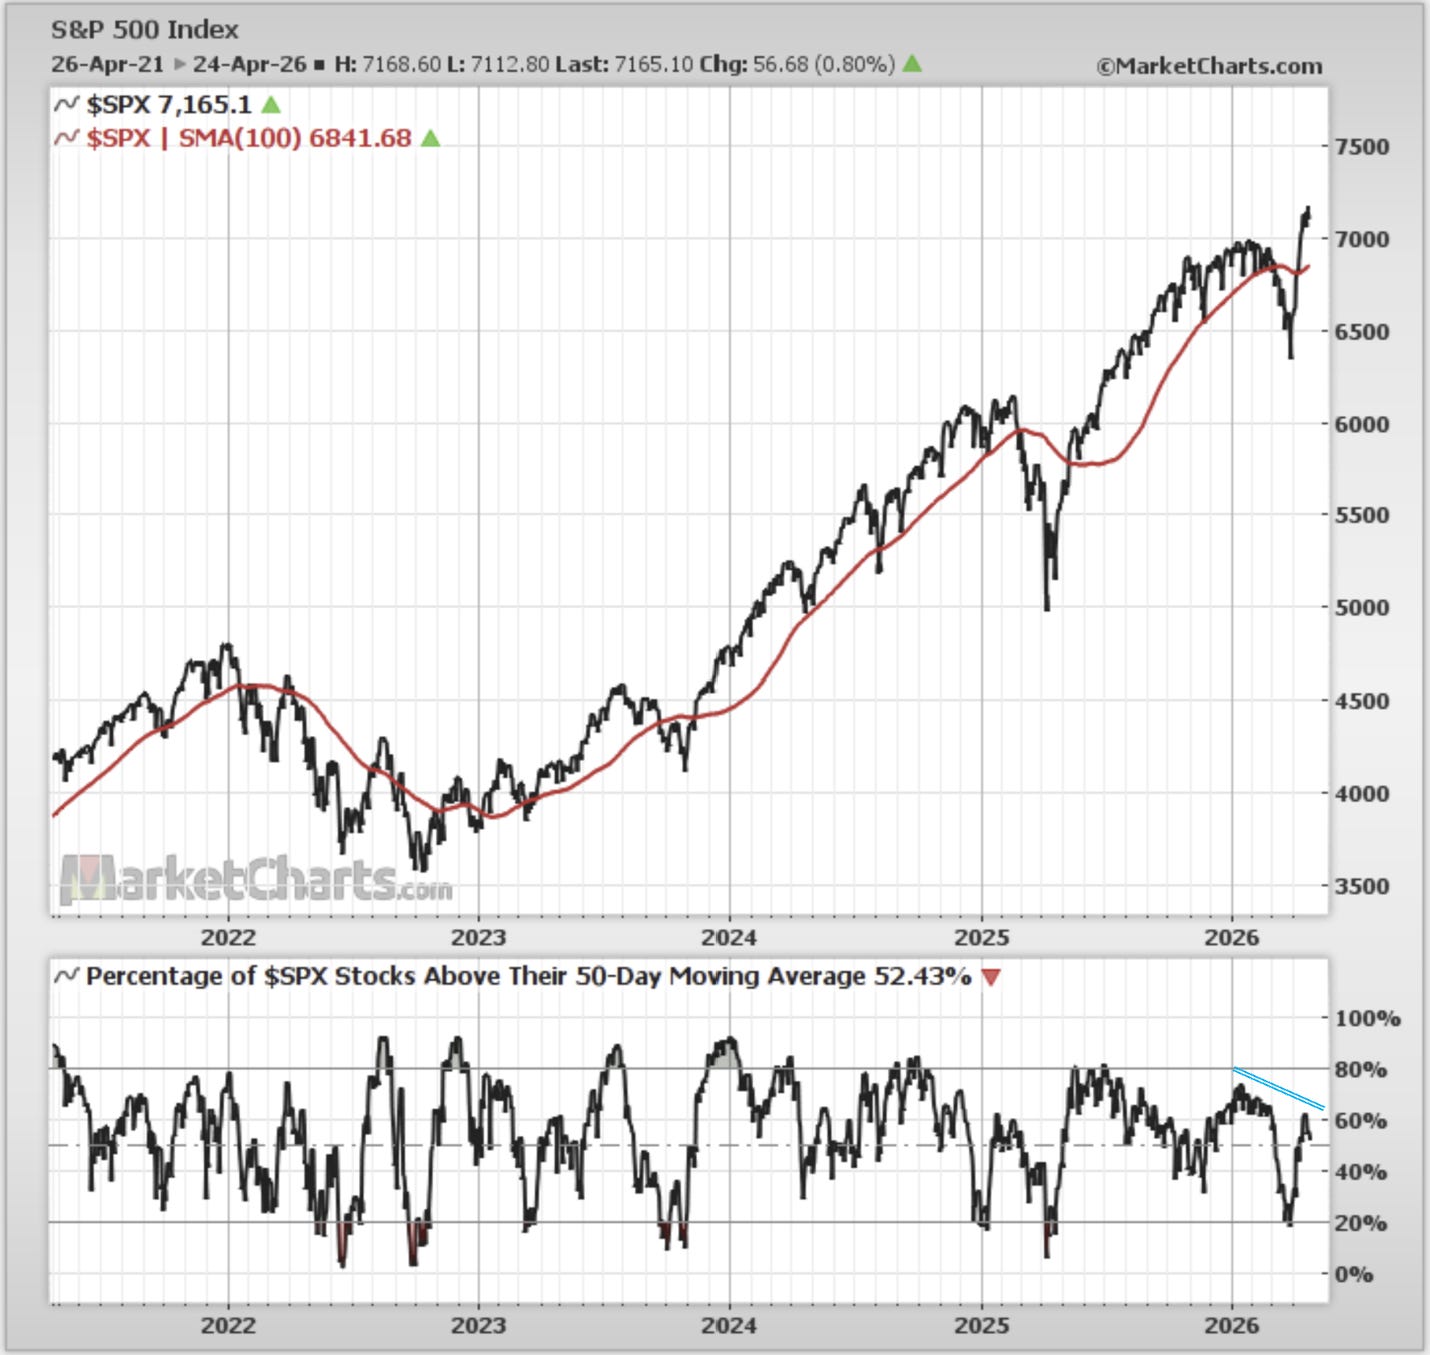
Source: MarketCharts.com
2. Mid-Terminal Seasonality: then there’s also the tendency for the coming months to be a bit choppy and weak during mid-term election years.
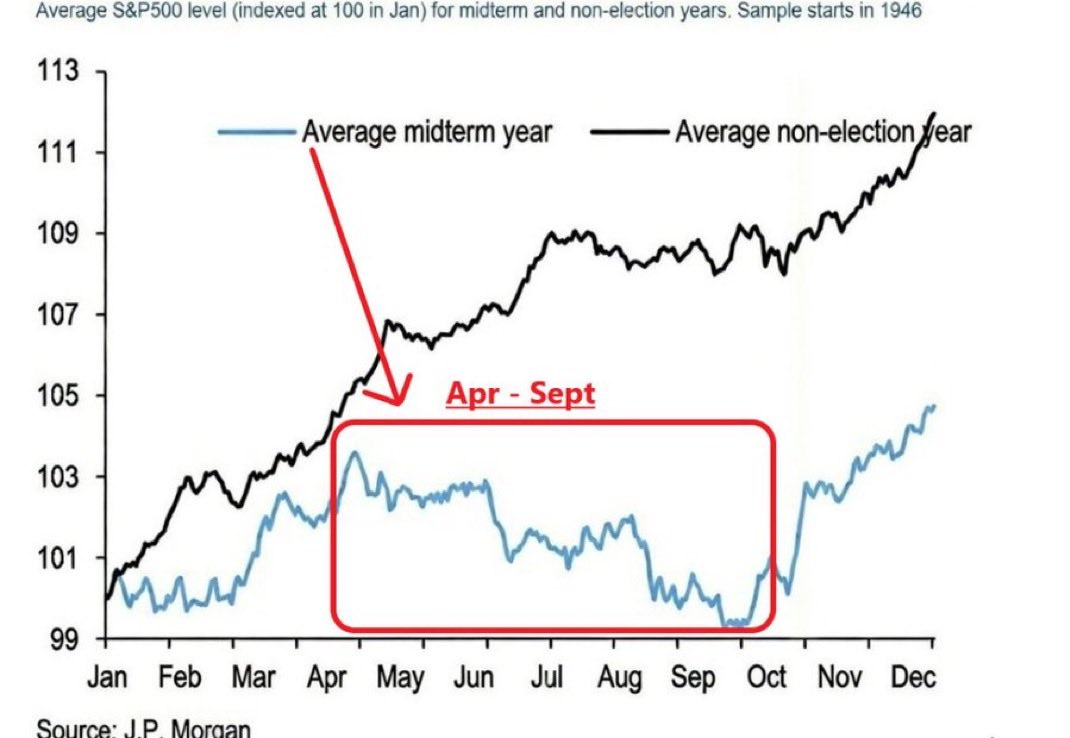
Source: @ThierryBorgeat
3. YTD-Conditional Seasonality: on the other hand, given we’re up +4.7% YTD, it’s worth highlighting that returns tend to be positive through that period when the market is up Year-To-Date.
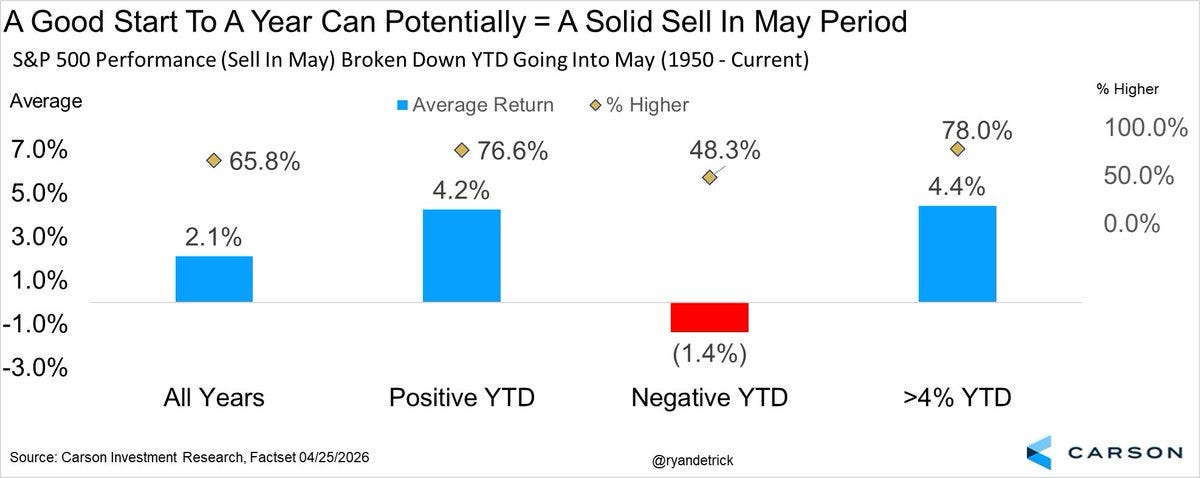
Source: @RyanDetrick
4. Fun Flows: meanwhile surging equity ETF flows show sentiment is alive and well, and there is apparently ample willingness and ability by investors to keep the trend going.
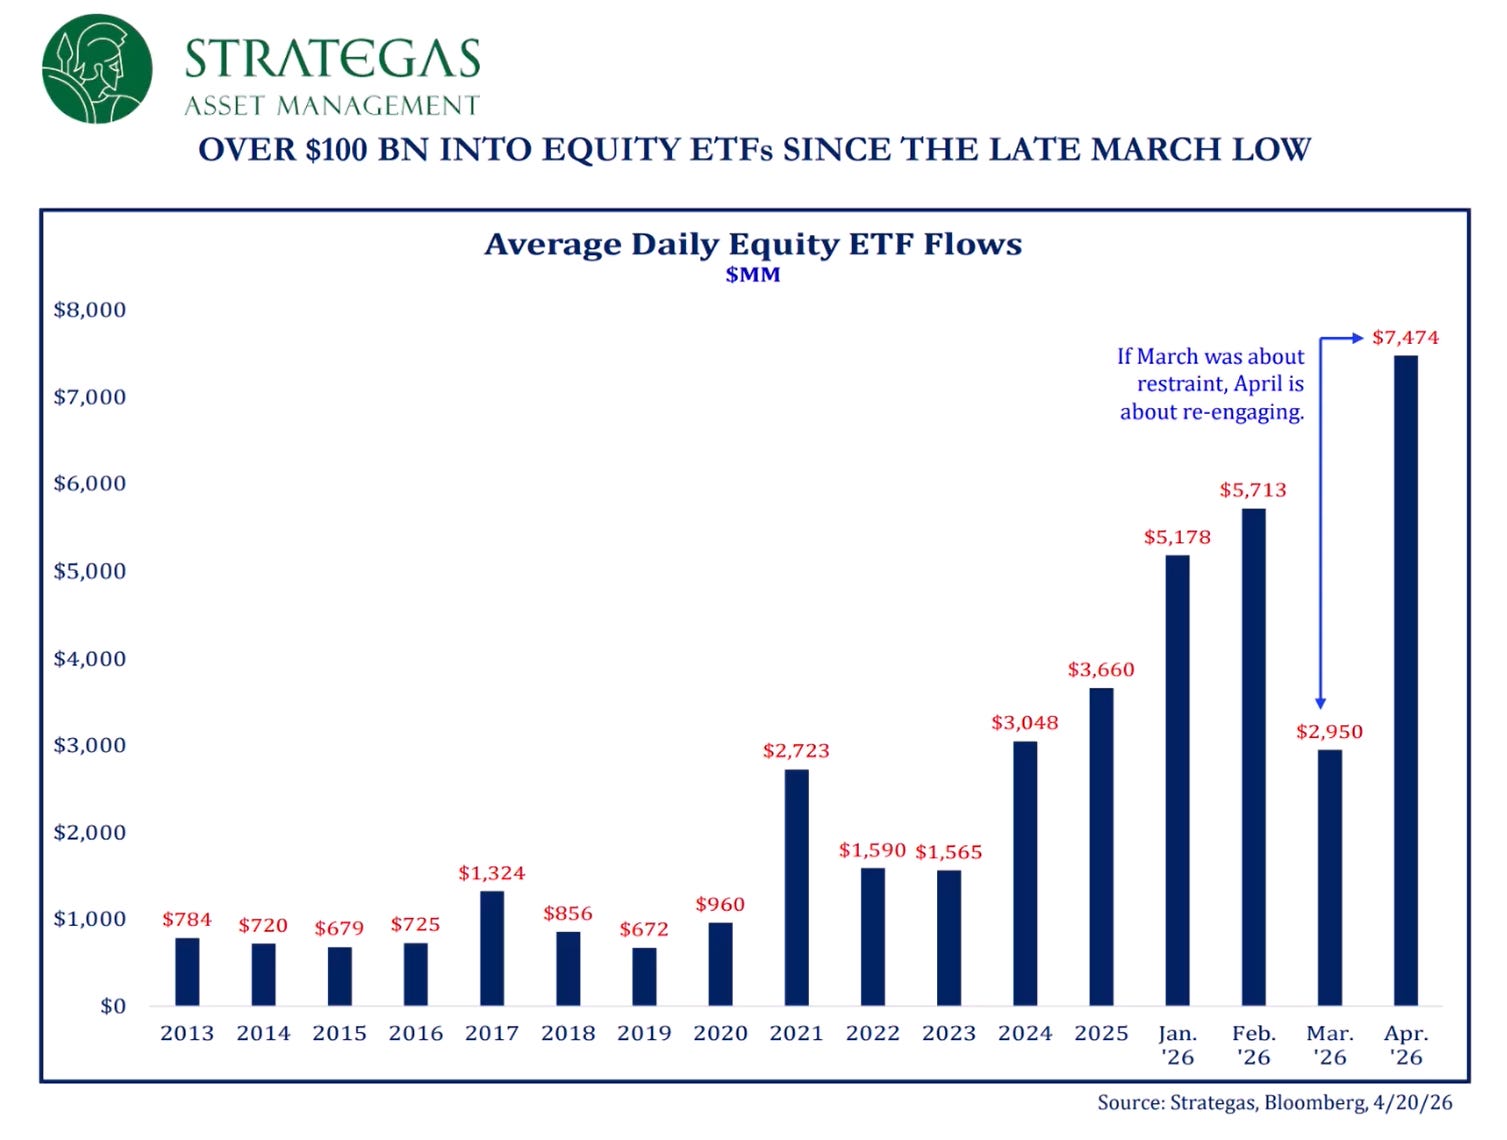
Source: Strategas Asset Management
5. Semi-Surge: meanwhile semis are just doing what semis do best in the AI age.
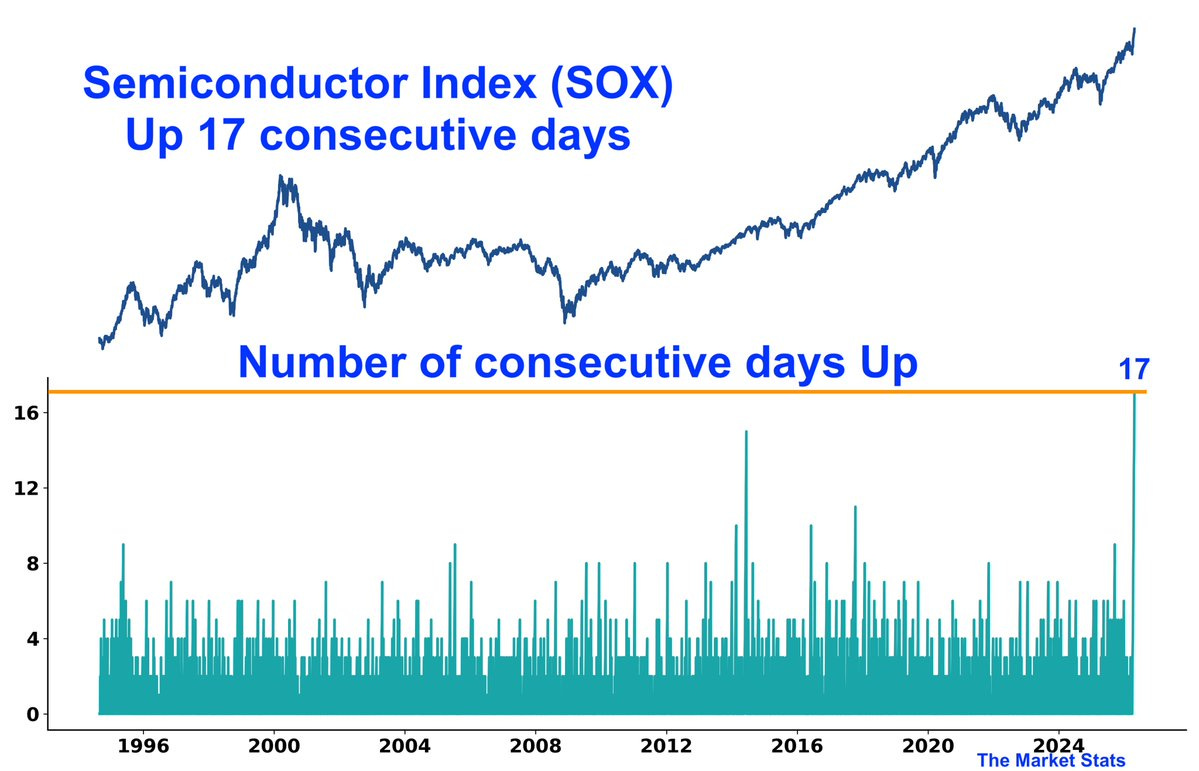
Source: @TheMarketStats
6. Semiconductors Market Cap Mooning: aside from the record number of consecutive days up, semiconductors market cap weighting also made a new all-time high last week at just under 14% (about double where it got to at the peak of dot-com).
Some might say that’s too far too fast, others might say it’s got room to run as semiconductors are the new oil. Time will tell, but what is true is both charts are extreme.
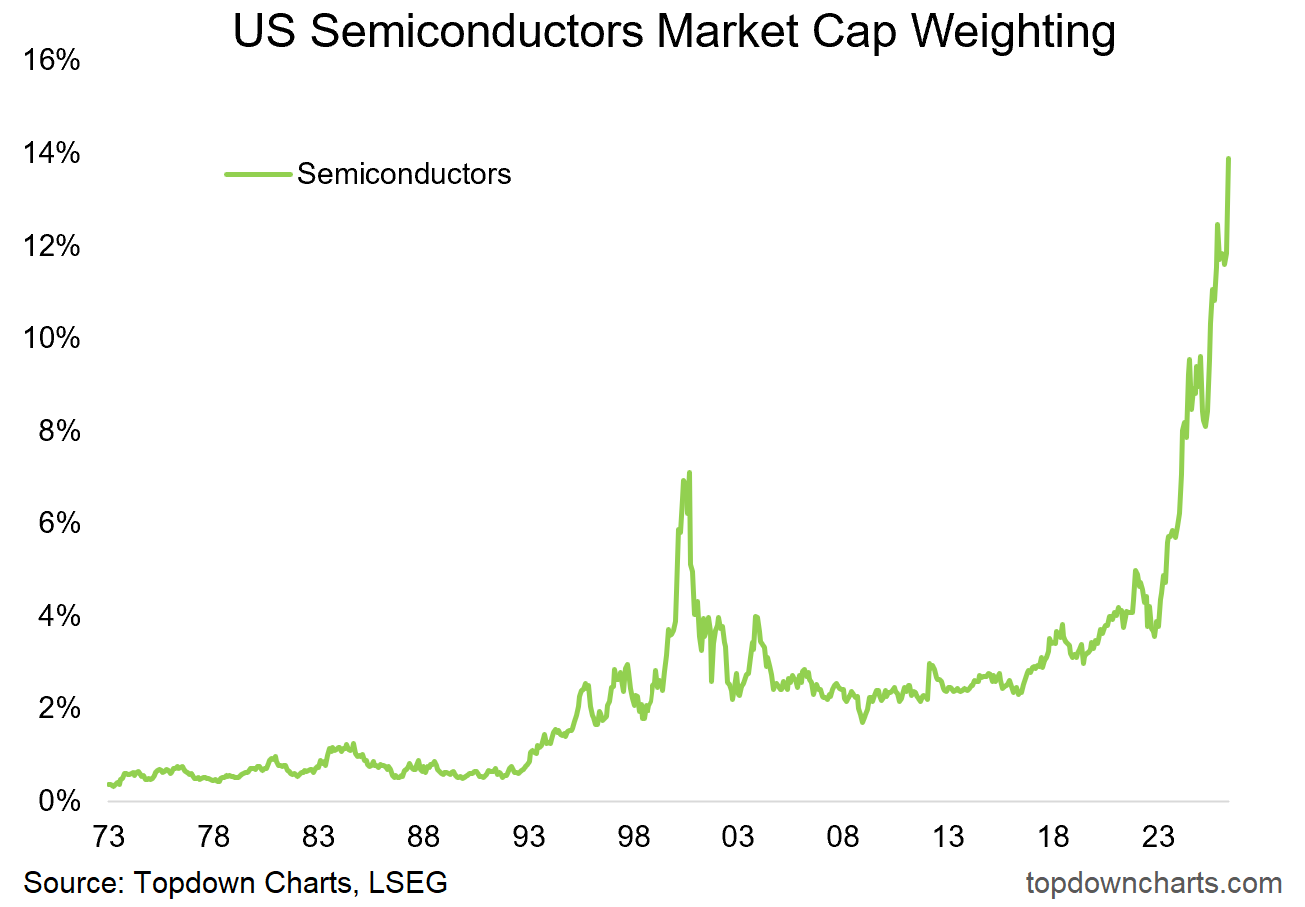
Source: Topdown Charts Professional
7. Ludicrous List: slightly related note, the number of big stocks with hefty price-to-sales ratios and 100%+ YoY gains is surging. Definitely some froth out there…
