
Weekly S&P500 ChartStorm - 27 July 2025
This week: volatility harbingers, seasonality, speculative waves and liquidity, equal-weighted index, sentiment, valuations, penny stocks, issues in asset allocation...

Welcome to the latest Weekly S&P500 #ChartStorm!
Learnings and conclusions from this week’s charts:
Volatility season is here (VIX tends to rise Aug-Nov).
VIX made a 5-month low, realized volatility is very quiet.
Stocks/Bitcoin/Gold are riding waves of liquidity and speculation.
The Equal-Weighted S&P500 made a new ATH last week.
Penny stock punting has doubled in recent years.
Overall, the rally continues to run its course. Momentum is strong and building, sentiment is resurgent, valuations are rising back into expensive territory, and promisingly we’re even seeing signs of bullish rotation and broadening out. But— there is a sense (and data points) that things have been a little too quiet lately, and that’s just as we head into what has traditionally been a more volatile time of the year for markets. I’d suspect that this year will be no exception, but let’s see…
n.b. check out the new “Getting Started” section (how to make the most of your subscription to the Weekly ChartStorm), and Reviews & Testimonials page.
1. Volatility Season: While most people are focused on the ongoing volatility compression following the tariff tantrum (e.g. the VIX just reached a 5-month low), I’m reminded of the tendency for volatility to rise around this time of the year.
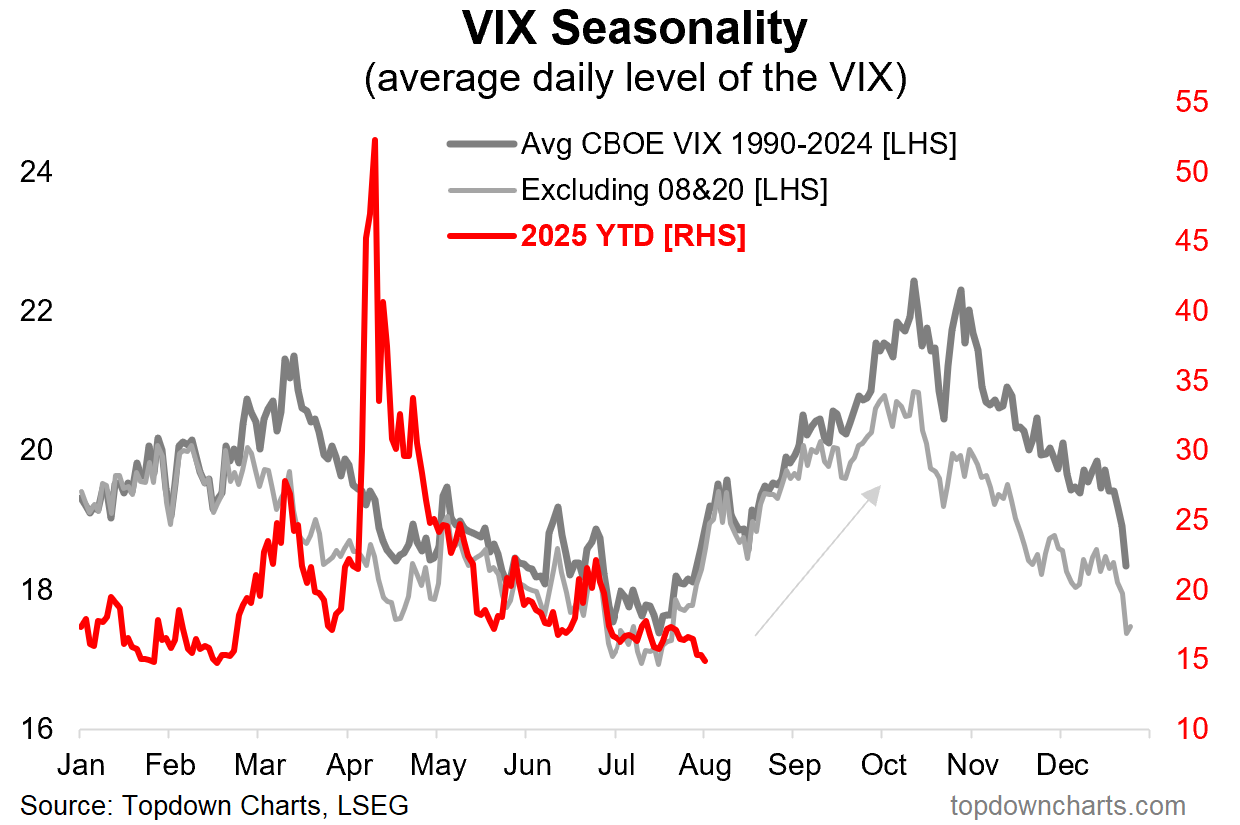
Source: Topdown Charts
2. One day One percent: And in terms of being “due” for some volatility, it’s now been 22 trading days since we last saw a 1% move up or down. If you feel like it’s been a little quiet lately —that’s why.
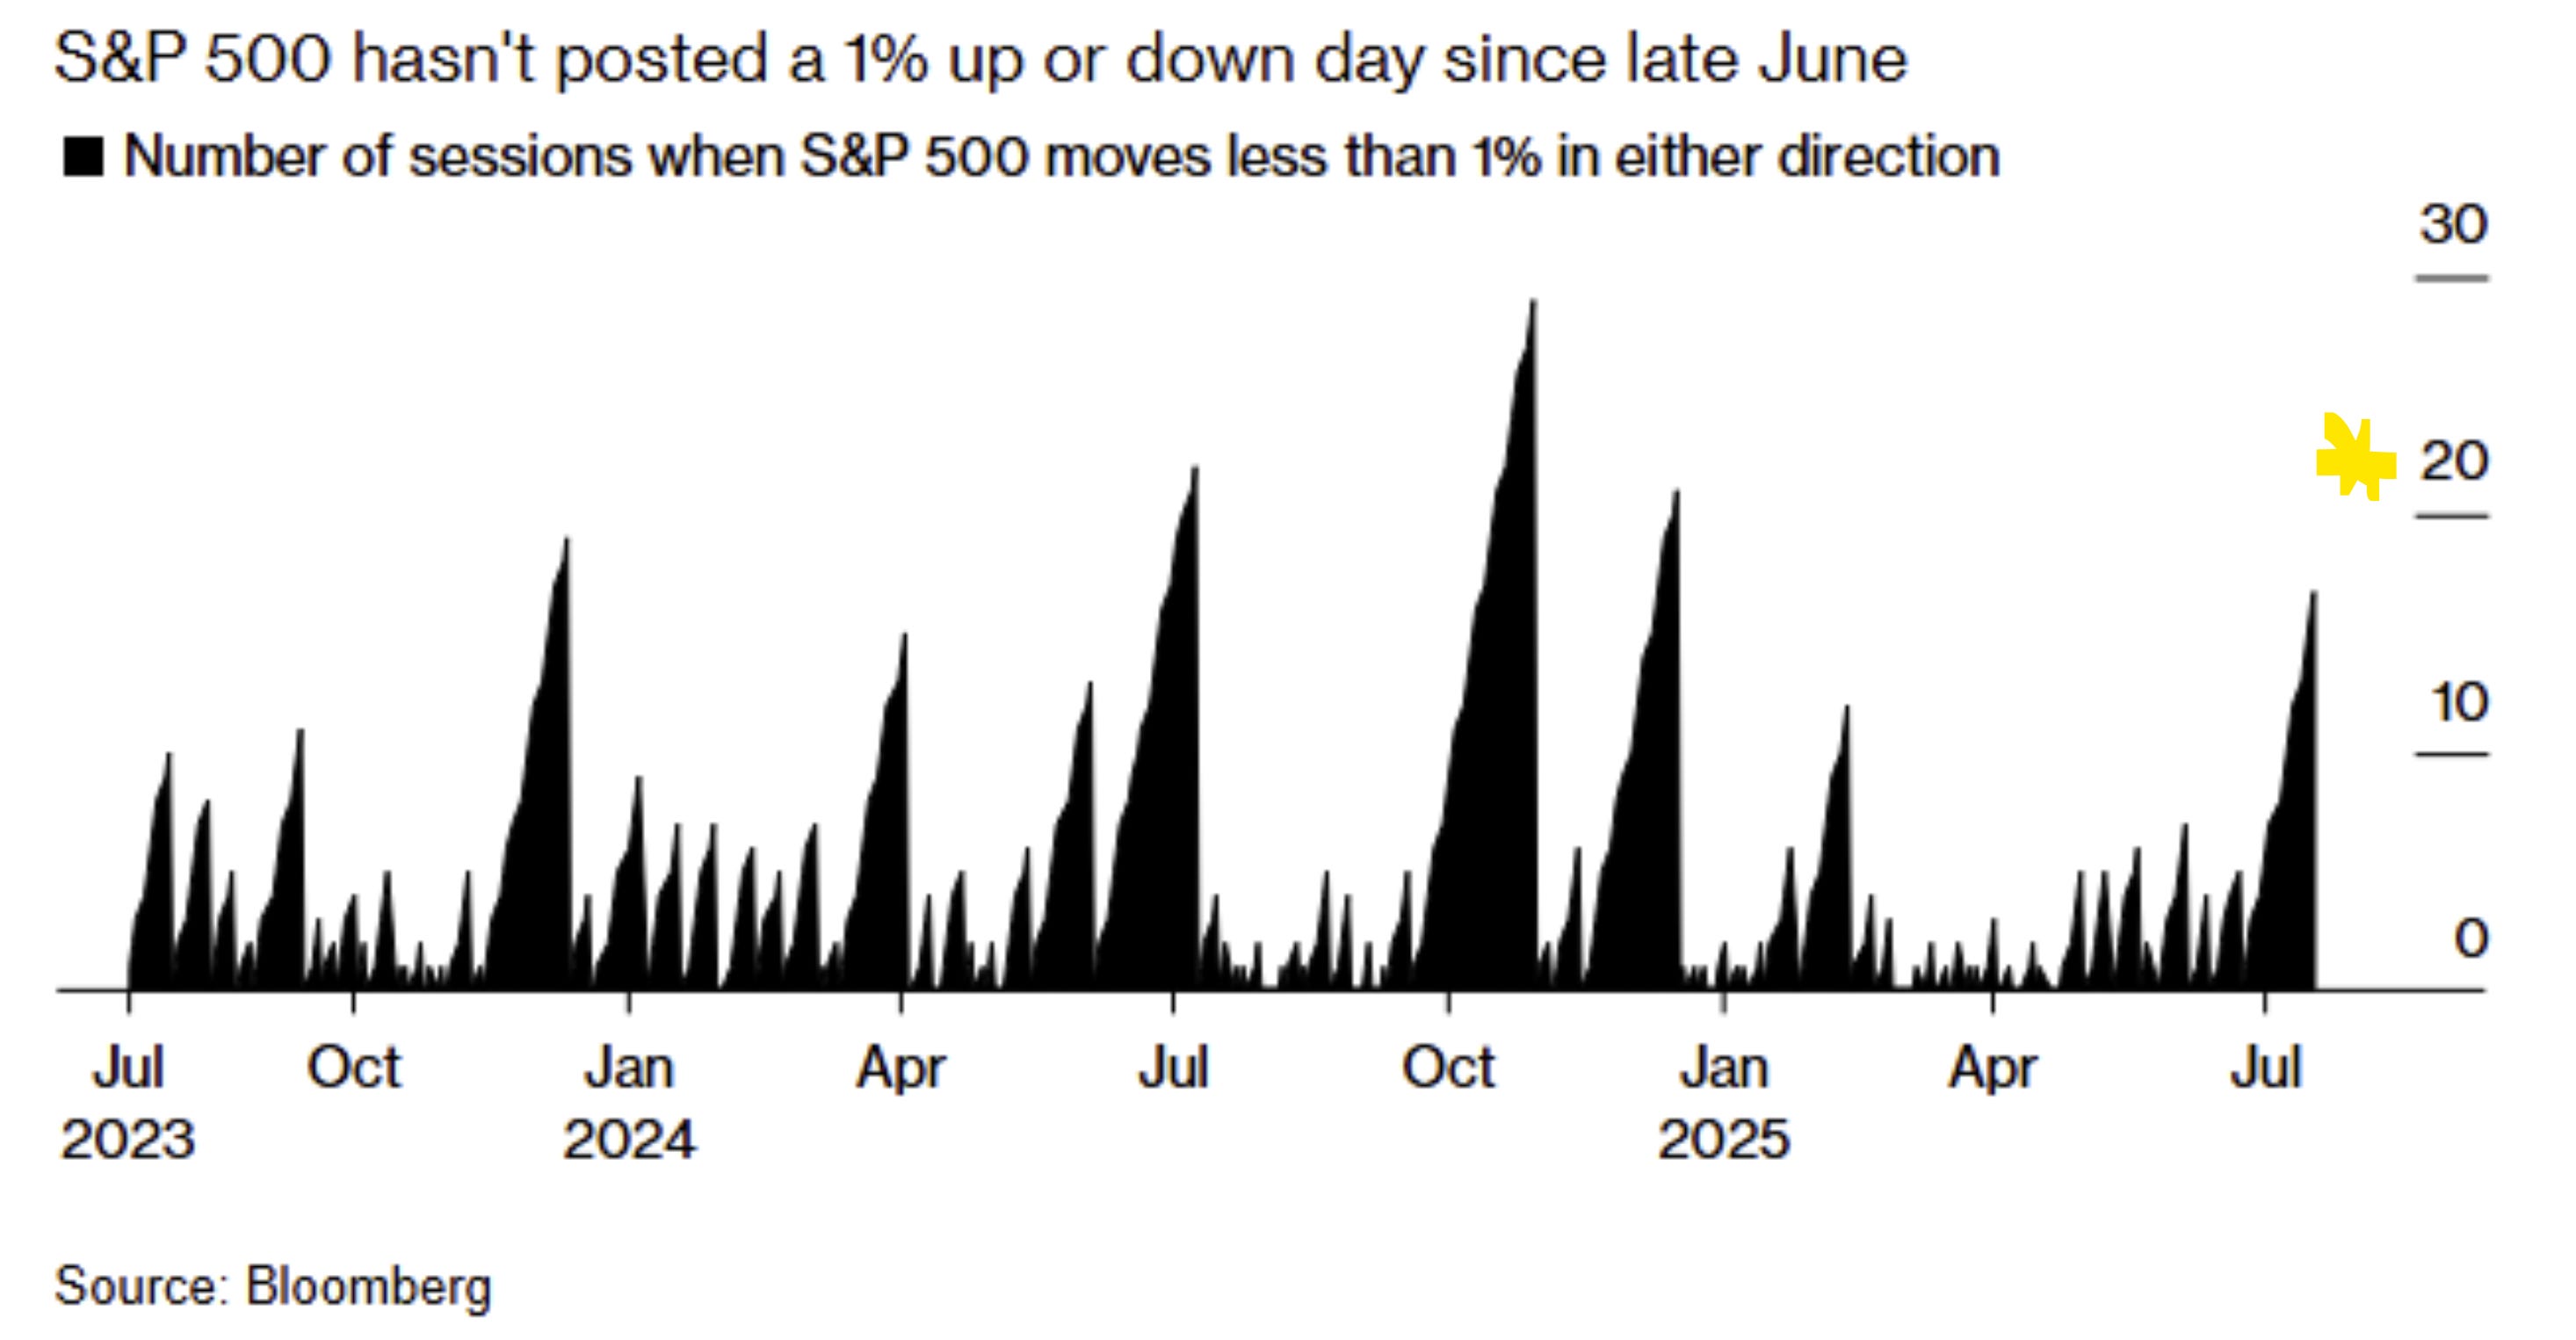
Source: @Barchart
3. Slippy Season: Seasonally speaking it’s the Aug-Oct period that tends to see the most volatile and worst returns for the year. I would note that I consider seasonality to be secondary or confirming information, and that it’s just a statistical description of what happened in the past —so by itself it is rarely good enough reason alone to form a view. But there are a few things on the horizon to consider e.g. the Fed-feud, inflation resurgence risk, froth in tech, tariff tinkering, geopolitics, to name a few.
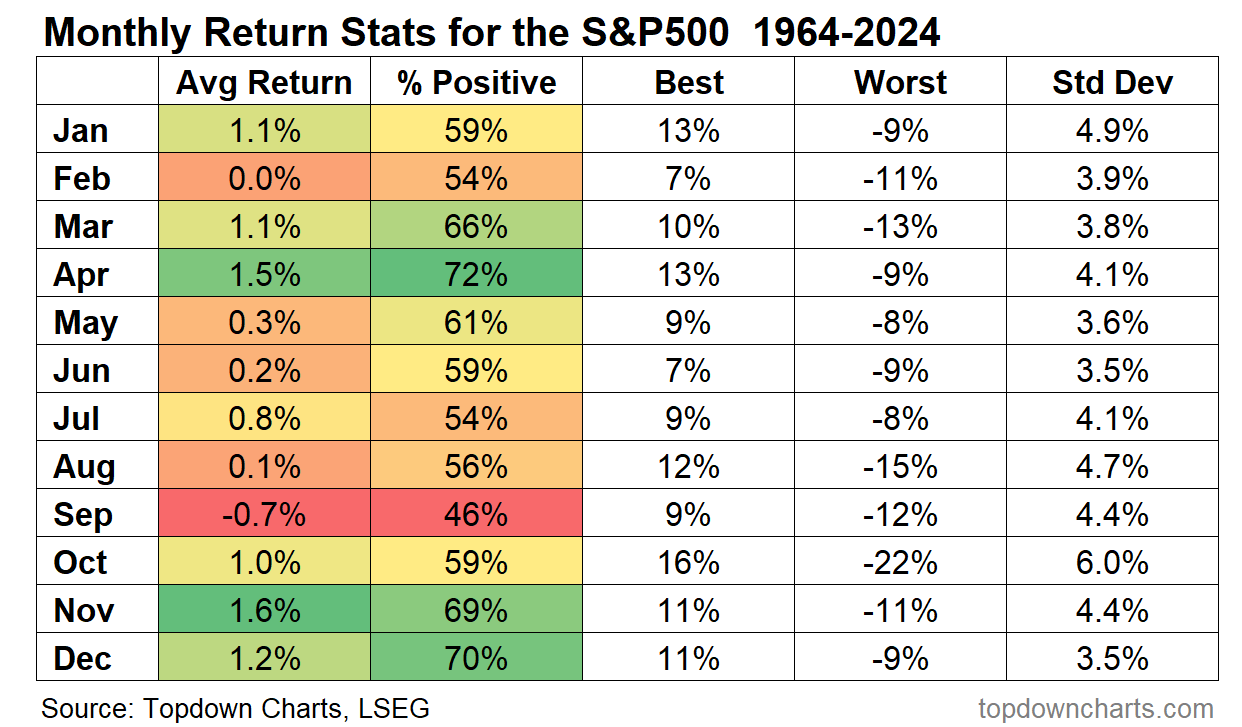
Source: Topdown Charts Professional
4. Speculation Waves: But meanwhile looking at the price action in tech stocks and crypto, markets are riding higher on waves of speculation.
n.b. I tend to look at the ebb and flow of bitcoin and Nasdaq as reflecting the ebb and flow of speculative risk appetite and system-wide liquidity.
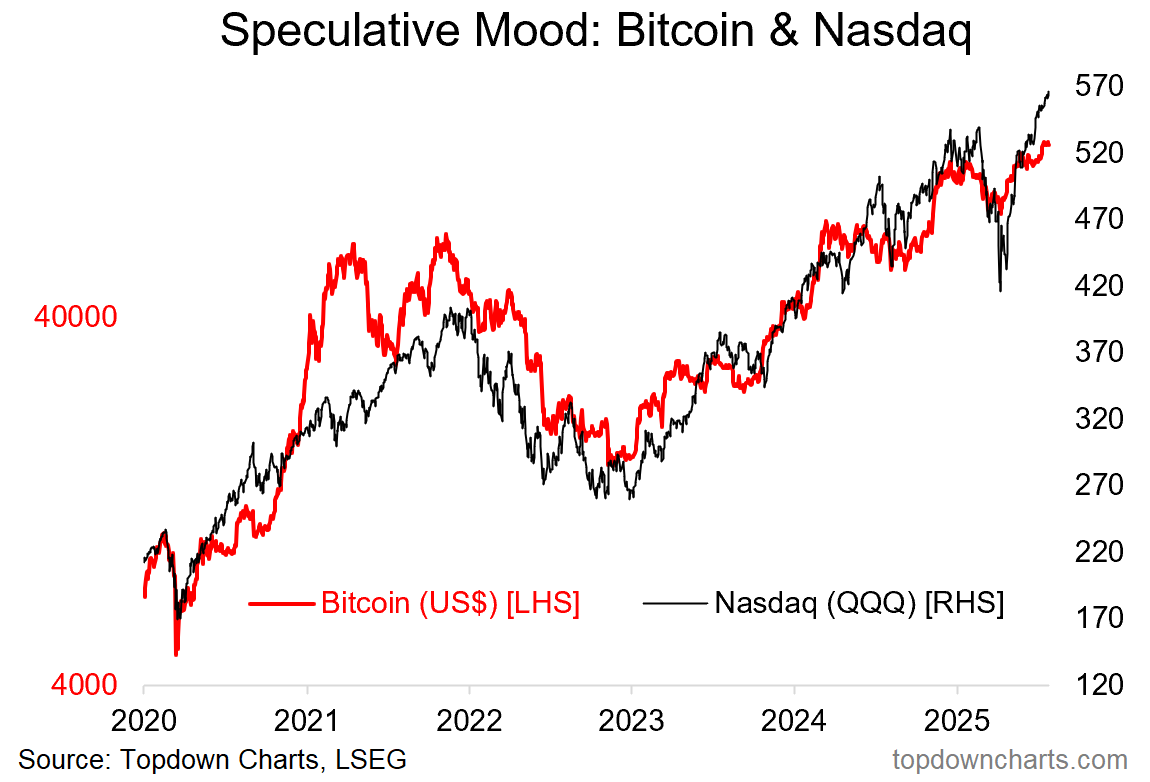
Source: Topdown Charts
5. Stocks & Gold: On a similar note, I thought this one interesting as aside from both gold and stocks looking expensive, the two have been riding similar waves over the past few years; hinting that the liquidity/debasement trade is the dominant force here.
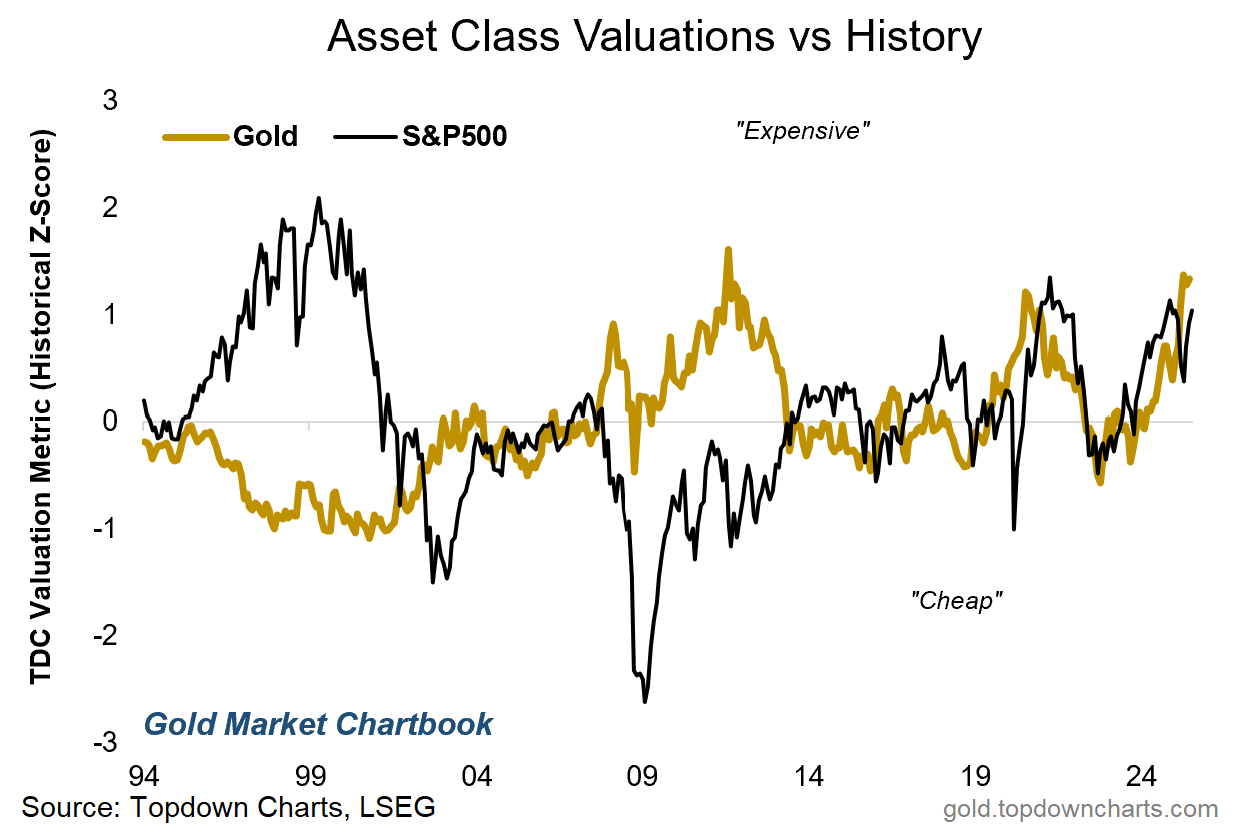
Source: Monthly Gold Market Chartbook
6. Equal-Footing: On the bullish side, the equal-weighted S&P500 finally made a new all-time high on Friday. This is important because the initial stages of the rally were quite concentrated, and this represents an element of broadening out.
