
Weekly S&P500 ChartStorm - 2 March 2025
This week: monthly charts, sentiment shifts, policy uncertainty, foreign flows, exceptionalism bubble, inheritances, and an important valuation indicator...

Welcome to the latest Weekly S&P500 #ChartStorm!
Learnings and conclusions from this week’s charts:
The S&P500 declined -1.42% in February (still up +1.2% YTD).
Consumer + Wall Street expectations are rolling over off the highs.
The spike in policy uncertainty + bearishness may help the market bounce.
Foreign flows have helped blow a “US Exceptionalism Bubble”.
Despite the selloff, US stockmarket valuations remain dangerously high.
Overall, there’s plenty of short-term indicators (e.g. surge in bearish sentiment) that make it easy for the market to bounce. But a rising body of more longer-term/cyclical bearish evidence looms. It’s a dangerous point in the cycle, with an uncharted policy backdrop, and hence the mood is steadily shifting…
UPDATE: check out the new “Getting Started” section (how to make the most of your subscription to the Weekly ChartStorm), and Reviews & Testimonials page.
1. Happy New Month… The S&P500 declined -1.42% on the month (with the equal-weighted S&P500 only dropping -0.77%, while the Nasdaq dropped -2.7%). The index is still up +1.2% YTD, but looking over the monthly closes there is a bit of a pattern emerging of one step forward, one step back as the index transitions from strong bull market to more of a volatile and ranging market.
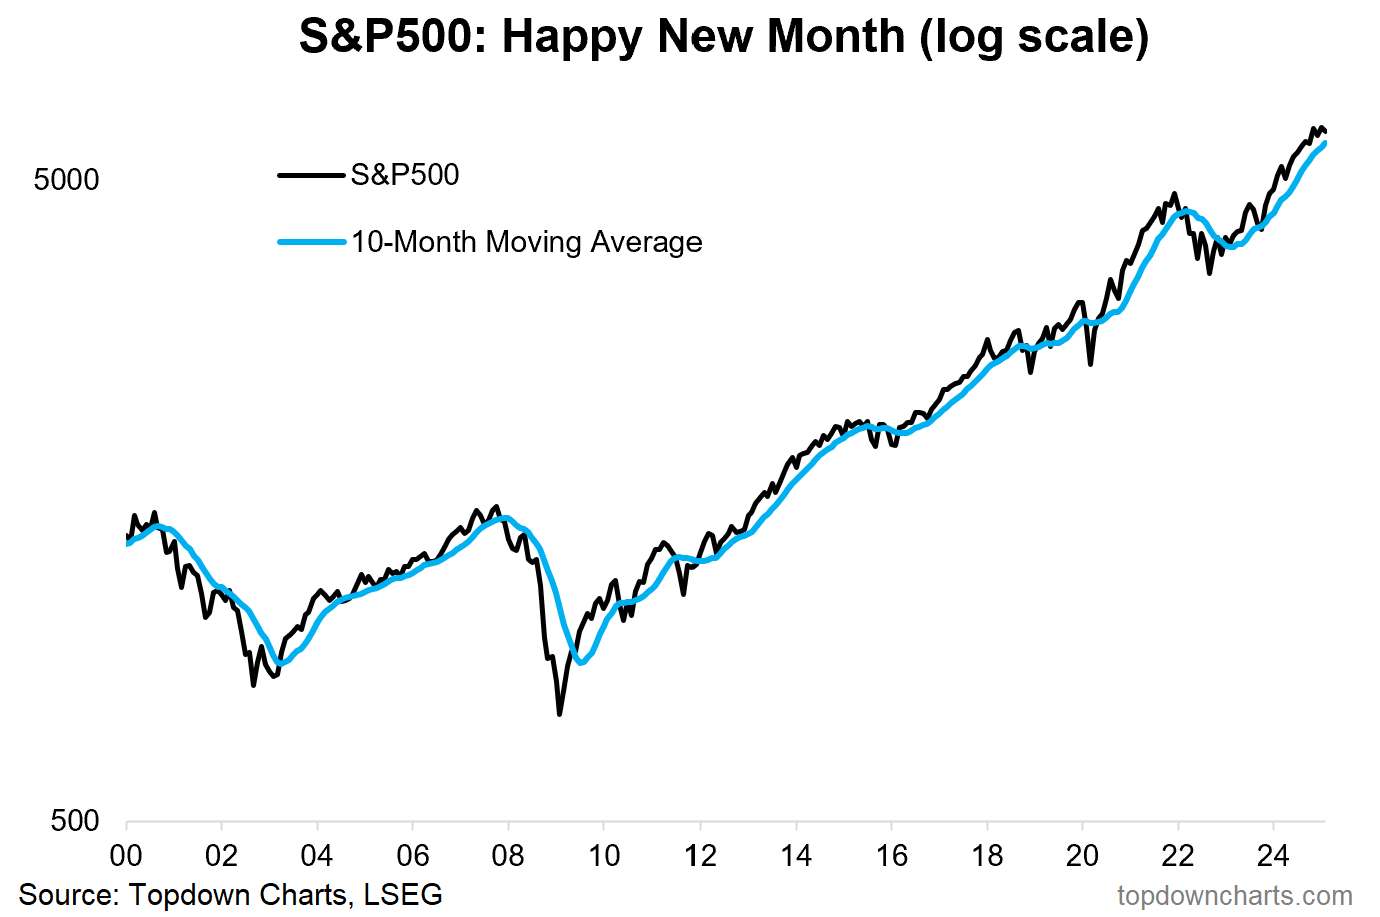
Source: Topdown Charts
2. Consumer Expectations: That theme is being echoed in the Conference Board consumer confidence survey, with stockmarket expectations pulling back further (to a 1-year low) from the November peak.
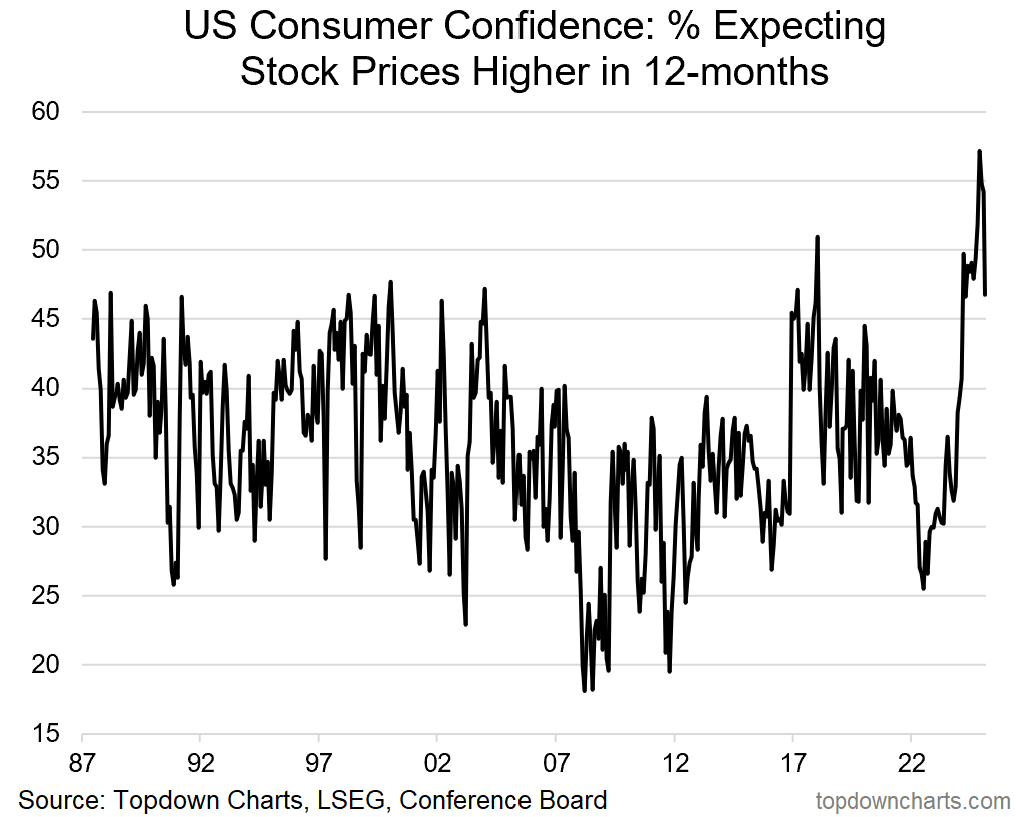
Source: Topdown Charts
3. Curbing Enthusiasm: That trend in turn is echoed or confirmed in my Euphoriameter indicator, which after reaching an all-time high in November has dropped to a 6-month low; and presents a concerning recuring pattern of sentiment and cycle indicators rolling over from previous strong readings.

Source: The Euphoriameter
4. Earnings Euphoria: Another angle on it is the I/B/E/S consensus long-term average earnings growth estimates, which have likewise rolled over from levels not too far off that seen around the peak of the dot com bubble.
