
Weekly S&P500 ChartStorm - 19 November 2023
This week: technical check, analogs, historical perspectives, real estate reduction, stocks vs bonds, not a great quarter, market concentration, sentiment divergence...

Welcome to the latest Weekly S&P500 #ChartStorm!
Learnings and conclusions from this week’s charts:
The rebound continues (even as roundnumberitis risk looms).
A broadening rally, positive seasonality, and historical analogs highlight a prospective path (much?) higher.
The Real Estate sector has dropped from 14% to 5% of the S&P500.
Bonds may be set to gain the upper hand vs stocks (given Fed peak).
A longer term perspective suggests that maybe heavy top-end market concentration is more normal than we may think.
Overall, there is almost a sense of if it’s going higher it’s going higher — or the engineering aphorism of “if it’s stupid but it works, it’s not stupid”. And maybe that’s the right approach, and maybe sentiment and technicals take the stock market higher for longer. But there are still some uncomfortable macro murmurings in the background. As noted in the bonus chart segment: investors are bullish on the outlook, while folk are gloomier than ever on the economy.
1. Surely not Roundnumberitis? As the rebound off the October low progresses (October 2023, that is) it’s worth reflecting on a couple of points. Firstly, even if this does end up being a repeat of the Oct 2022 rally — the path from trough to peak was far from a straight line that time (basically 2 major up moves book-ending a multi-month range-trade), so we shouldn’t expect a nice smooth ride this time either.
That said, one point to note on the upside is how breadth has been rapidly improving (increasingly broad-based participation of individual stocks in the rally). But finally, and in the short-term… that weird and ugly neologism: roundnumberitis — can the market hold onto its reclaimed 4500-level?

Source: MarketCharts
2. Imagine: I don’t like analogs that much, but I concede that they can provide at least a rough conceptual model of how things might play out based on how they did in the past. That disclaimer notwithstanding, imagine what a move like this would do to sentiment (and I documented last week just how substantial the shift in sentiment has already been).

Source: The Market Ear via @MacroTactical
3. Imagine: Zooming out, another exercise for your imagination and perspective — in real (CPI-adjusted) terms, it’s not unusual for the S&P500 to experience lost decades. Actually it’s kind of normal and regular.

Source: @mkt_sentiment Market Sentiment
4. Where did REITs go? Kind of a stark chart; shows REITs going from 14% of the S&P500 market cap at their pre-08 peak, down to now less than 5%. Makes you think — do REITs deserve a less-than-5% allocation?
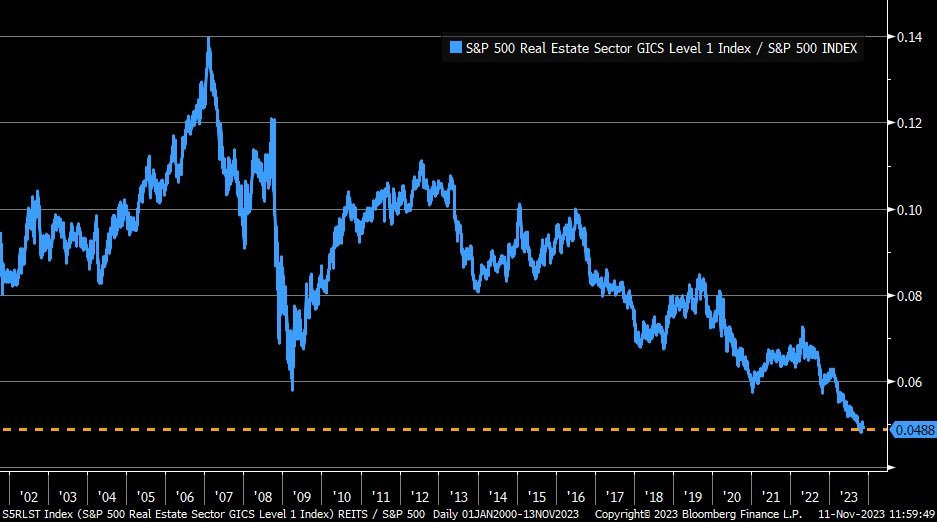
Source: @KobeissiLetter
5. Real Estate Sentiment: While sentiment is turning on the stockmarket as a whole, one area where investors are reporting extreme pessimism is on Real Estate — which is part of the reason behind the recent 11%+ rally in REITs. Investors hate the asset/sector, allocations are at record lows, and to be fair price is still down over 30% off the Dec 2021 peak despite the rebound, and there are lingering risks. But if rates move lower and CRE doom is avoided, REITs see upside.

Source: [VIDEO] 3 Things you Need to Know about REITs Topdown Charts
6. Speaking of Rates: If this is the end of the rate hiking cycle, stocks may not be the best place to be. The past few Fed peaks portended a turning point in the cycle of relative performance for stocks vs bonds.
