
Weekly S&P500 ChartStorm - 12 May 2024 [free version]
This week: the trend, the chase, the VIX and all things volatility, China, Canada, and loan officers' opinions...

Welcome to the latest Weekly S&P500 #ChartStorm! [free preview version] — the Weekly ChartStorm is an easily digestible selection of charts which I hand pick from around the web and my own files. These charts focus on the S&P500 (US equities) with a particular emphasis on the forces and factors that influence the outlook, to bring you insight and perspective.
Learnings and conclusions from this week’s charts:
The underlying trend is bullish.
Volatility (the VIX) is low and falling.
Credit spreads and tail hedging demand is also low.
Some signs are pointing to an upturn in volatility.
China is ticking up, Canadian stocks are cheap.
Recommendation — Macro Charts joins Substack
Good news everyone, one of my favorite Twitter follows @MacroCharts has joined Substack — he presents very interesting and useful proprietary charts, along with insightful and well-written posts. Go check out his new publication:
1. The Trend is Your Friend: This is an interesting way of presenting the path of price — by looking just at the 200-day moving average itself. For a lot of investors, this is probably a much more useful chart than the daily tick-by-tick. And the message or current status is fairly clear.

Source: @RyanDetrick
2. Retail Rush: After a period of slumber, retail animal spirits have risen once again and the greed train has left the station.

Source: @jessefelder
Reminder: Subscribe to the [Free] Chart Of The Week
Gain access to original macro/market charts + insights from
3. Tail-Risk Hedging: A very interesting contrast to the previous chart — pricing for deep out-of-the-money puts has plunged to multi-month lows (basically the demand for tail risk hedging has dried up).

Source: @Nations_Indexes
4. The VIX of VIX: Similarly, the VVIX (volatility of volatility) just made its lowest close in about 8 years — so it raises a question of sorts: do you go with the momentum here of rising stock prices and falling volatility? or do you take the contrarian perspective that this is the flipside of greed and represents deep complacency?

Source: @Swordfishv44183
5. Credit Spreads: Another angle on this — credit spreads are also plumbing the lows, again we can consider 2 thoughts; a. it’s a good thing because it means credit markets are running smoothly and there’s no default issues and the trend is down not up, or b. it’s a bad thing because there is no cushion for default risk, doesn’t factor in mixed macro signals, and credit spreads are expensive at these levels. And well, both of those thoughts are basically true (until they’re not).

Source: Chart of the Week - The Calm
See also: Outlook for Credit Spreads (research report)
6. Volatility Seasonality: One point to consider in all this —> seasonality has a say. Credit spreads and volatility have a historical tendency to rise during the May-Oct period (mirroring the tendency for stocks to be weaker during that period also). And this year we have (geo)politics to contend with, notably November.

Source: Off-Topic ChartStorm - Sell in May?
Market Cycle Guidebook
I published my latest monthly pack at
last week — be sure to check it out.
The monthly Market Cycle Guidebook is designed to be a practical & tactical asset allocation guidebook for global multi-asset investors +those who require visibility and insight on the big picture outlook (click through to access).
7. The Clock is Ticking: Meanwhile, when it comes to the VIX, the Fed has started the timer. The VIX tends to rise when the Fed hikes rates (with a ~2-year lead time). Unless things are different this time, that means we are right about due to see the trend turn for volatility.

Source: Off The Charts
8. The Tape is Turning? And if we look at this unusual volatility indicator (which is simply the rolling annual count of daily price changes worse than -1%), it looks like it has turned up already after plunging to the lows. Historically that is not a good sign.

Source:
9. China Bulls and Bears: One area of the markets that is looking brighter though is Chinese stocks, and one of the key bullish points is how bearish everyone still is on China (yes some market technicians will be on board with the price action, but the consensus/crowd is still very skeptical and pessimistic on China). In particular, short covering could soon become a tailwind if the recent uptick in Chinese stocks continues.
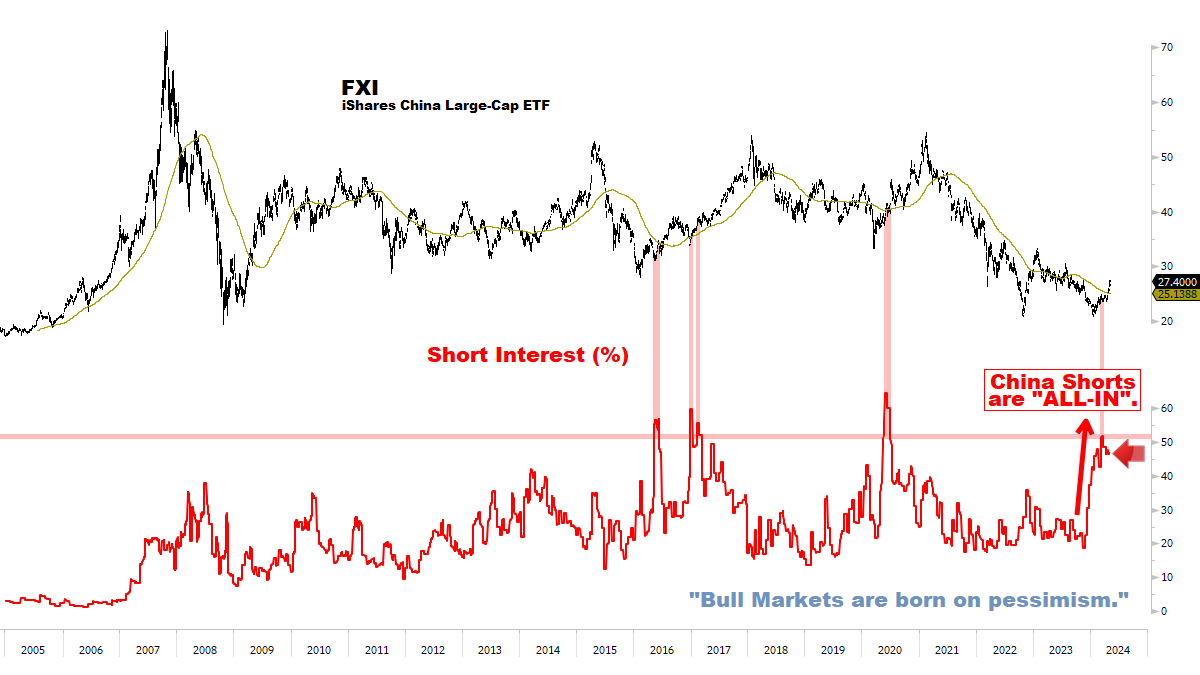
Source: Something Incredible is Happening in China MacroCharts
10. The Canada Discount: While some might argue this is a result of politics, and there probably is some element of that, the bigger issue for Canadian vs American stocks is sector skews. Canada has a much greater weighting to value sectors vs growth sectors (and we know value has majorly underperformed vs growth) e.g. Canada has 30% in Energy + Materials (vs 6% in the S&P500), and 35% in Financials (vs US 13%), meanwhile only 8% in Tech (vs more than 30% for the US). Which goes to show that often times country selection is as much about sector selection than anything (but there still can be significant opportunities).

Source: The DailyShot
BONUS CHART SECTION… n.b. Paid subscribers received additional chart(s) + mini-blog on the latest Fed loan officer survey —and what it means for the stockmarket outlook (upgrade to paid to access)
Paid Subscriber Benefits:
Access to the Bonus Chart section (exclusive chart/theme/insight)
Access/Participation in the Comments Section (paid subscribers only)
Have your Questions Answered (by email or in the comments)
Quick+Responsive Customer Service (no issues unresolved)
Ad-free (no ads in the way, no marketing emails)
Upgrade to paid for instant access to these benefits to gain a greater level of insight and join a community of intelligent investors
Thanks and best regards,
Callum Thomas
Founder & Editor of The Weekly ChartStorm
Twitter: https://twitter.com/Callum_Thomas
LinkedIn: https://www.linkedin.com/in/callum-thomas-4990063/