

Welcome to the latest Weekly S&P500 #ChartStorm!
Learnings and conclusions from this week’s charts:
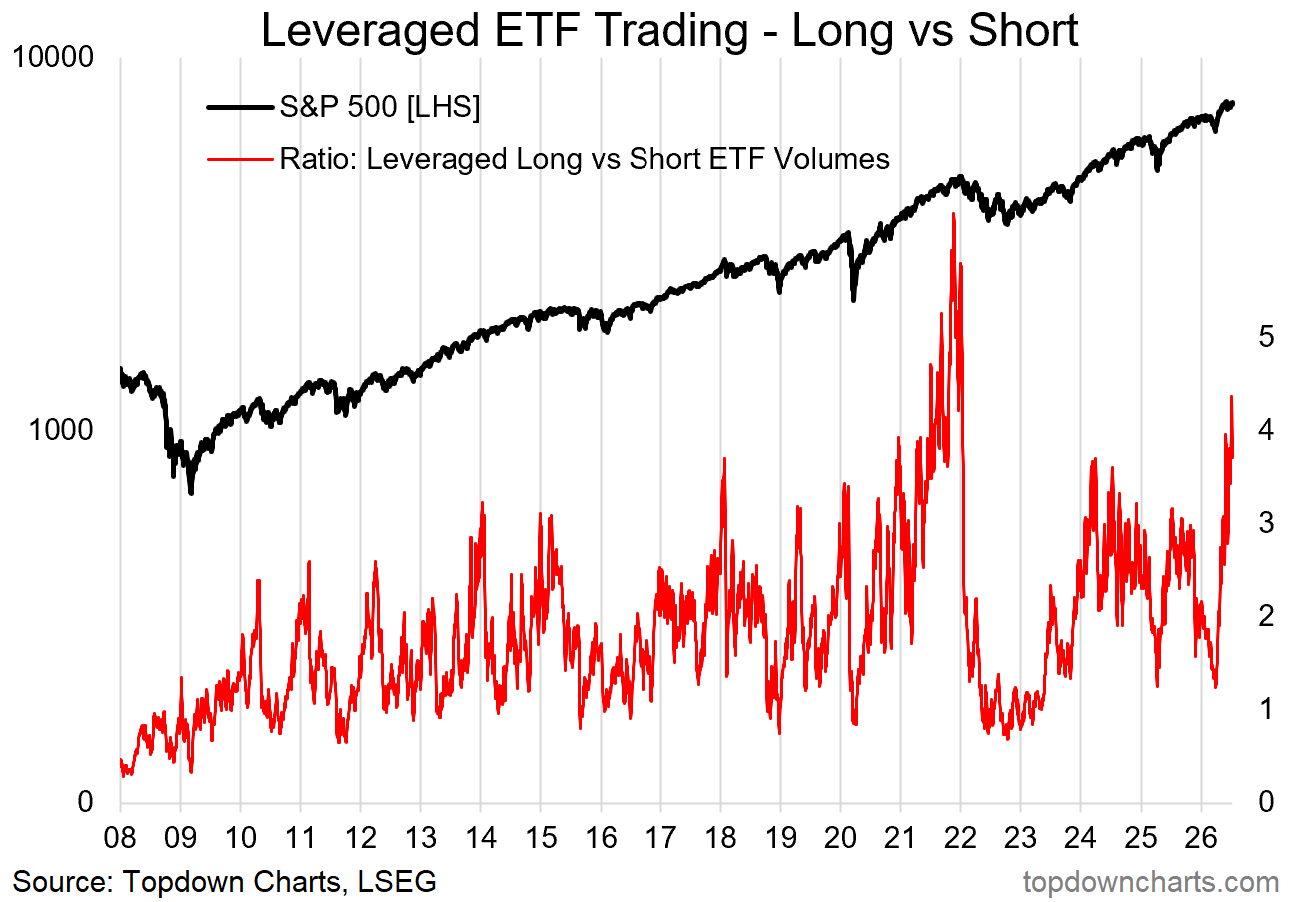
Speculative trading in leveraged ETFs has surged.
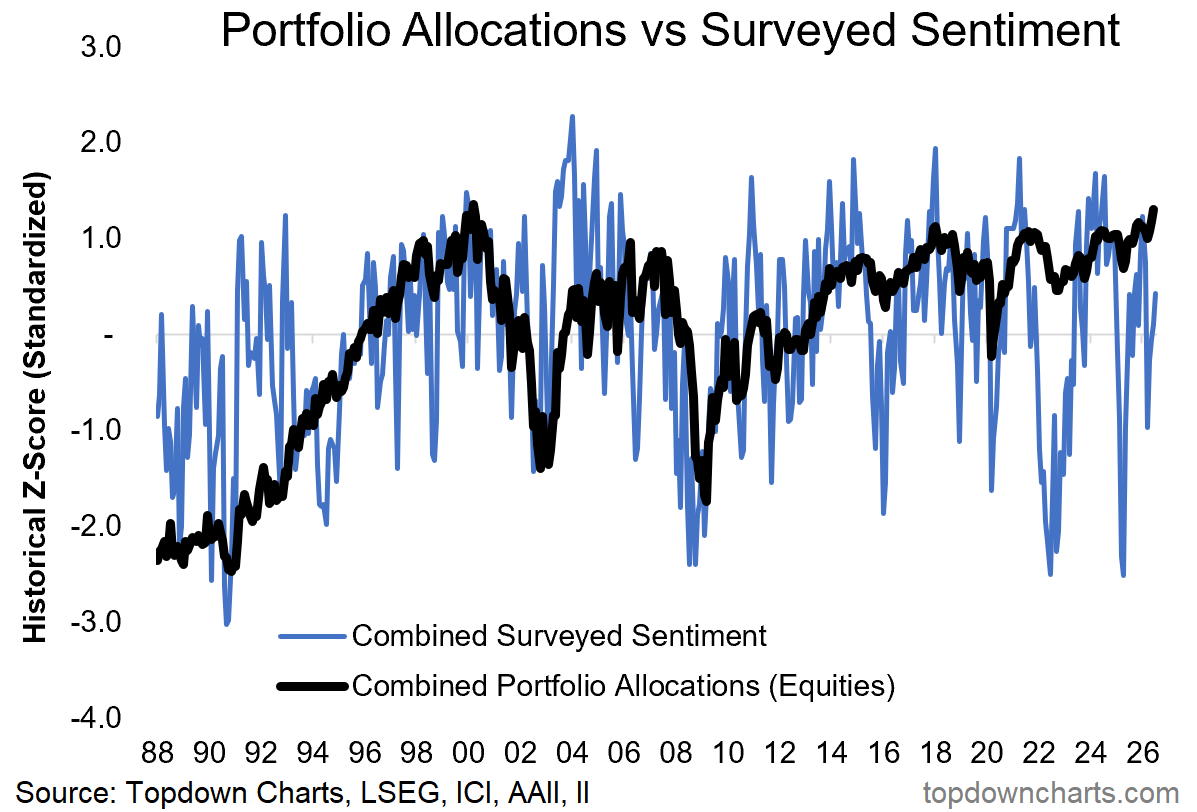
Investors are increasingly all-in on stocks (portfolio allocations).
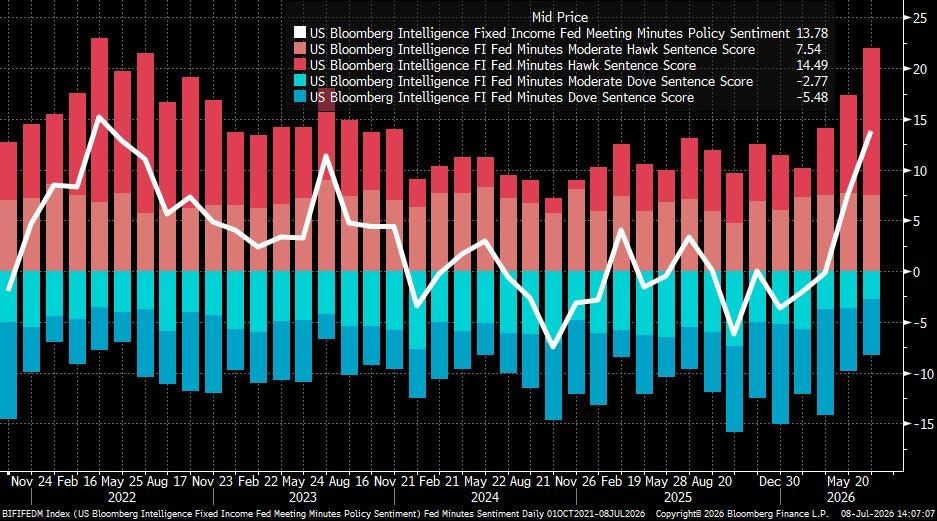
The Fed is becoming more hawkish (echoing global pivot to rate hikes).
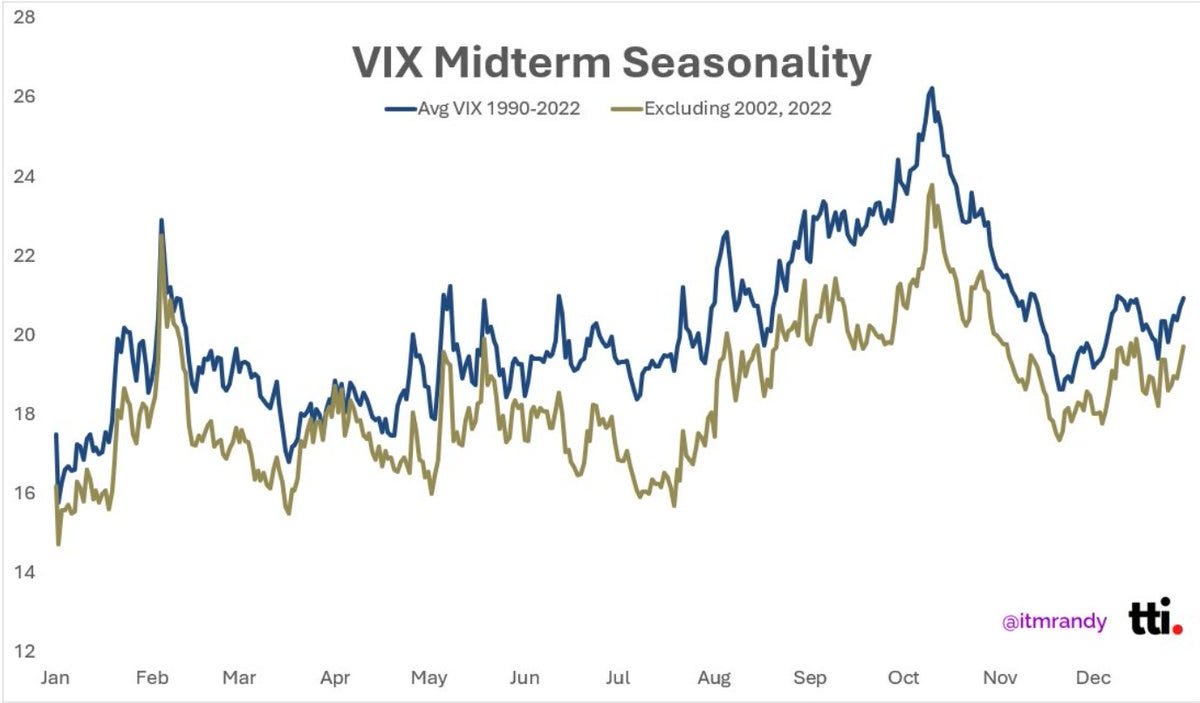
July-Oct tends to be a more volatile time of the year (historical averages).
A long-term trend change is underway in US vs Global relative performance.
Overall, a number of risk flags are starting to wave (both on the shorter-term/tactical and bigger-picture/longer-term horizons) as we head towards what has historically been a more volatile time of the year.
1. Leveraged ETF Trading: after the healthy correction of Q1 and subsequent confidence boosting buy-the-dip rebound of Q2, speculative trading has surged. As such, the leveraged ETF long vs short ratio is now in warning territory.
Source: Topdown Charts Professional
2. Allocations vs Sentiment: but here’s where sentiment and positioning get interesting, while investor portfolio allocations to stocks are hovering around record highs (i.e. what they are doing), surveyed sentiment is only mildly bullish (i.e. what they are saying). I would say actions speak louder than words here, and the actions say investors are basically already all-in.
3. Fed Hawk Rising: as for potential risk catalysts, the Fed appears to have drifted firmly toward the hawkish side (and to be fair that is where the data, which Warsh says he is going to be more dependent on, is pointing). And it is already the global direction of travel, with rate hikes dominating vs cuts across the central banks I monitor.
Source: @LizThomasStrat
4. Tis the Season for Volatility: historical seasonal patterns point to higher volatility in the coming months, and I would have to say the sentiment/positioning and potential macro catalysts sure seem to line up with that.
Source: @itmrandy
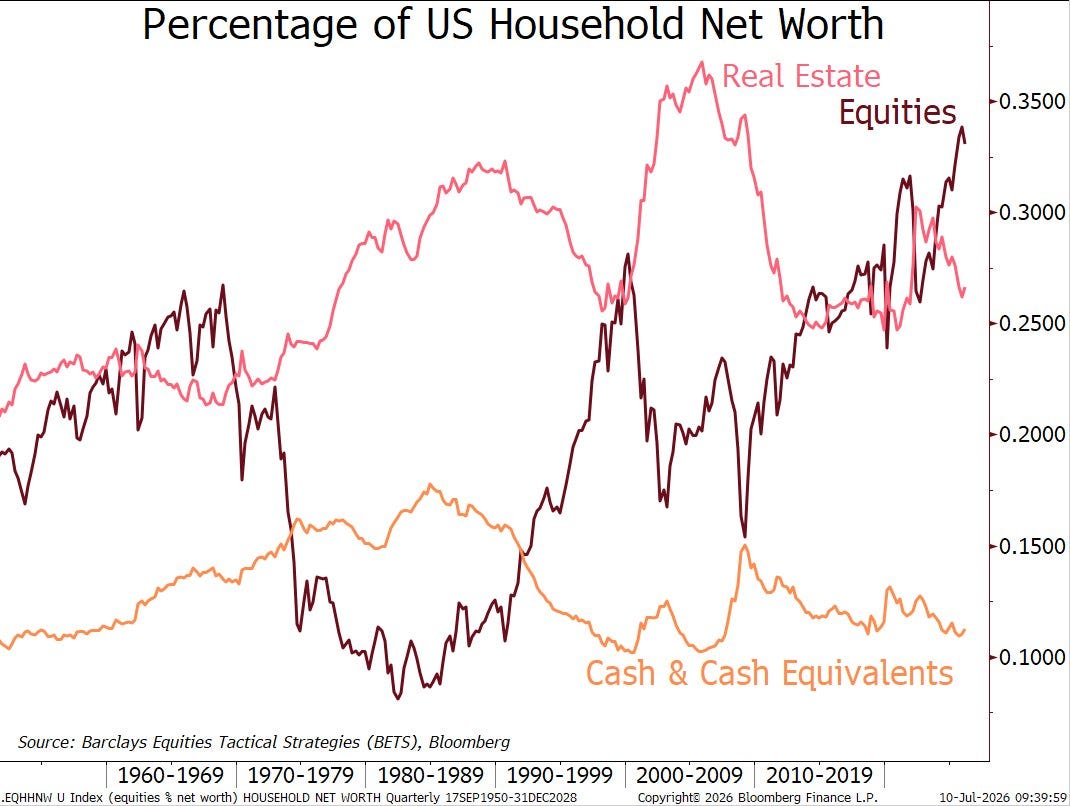
5. Household Asset Allocation: as a point to ponder, the average household now holds more of their wealth in equities than real estate. This leaves us in an interesting situation where the next major market meltdown could have real economy impacts through negative wealth effects (and confidence) …and the next major market downturn probably only happens when the economy rolls over or a crisis precipitates (so it becomes a bit of a negative-spiral flash point risk).
Source: @TheStalwart
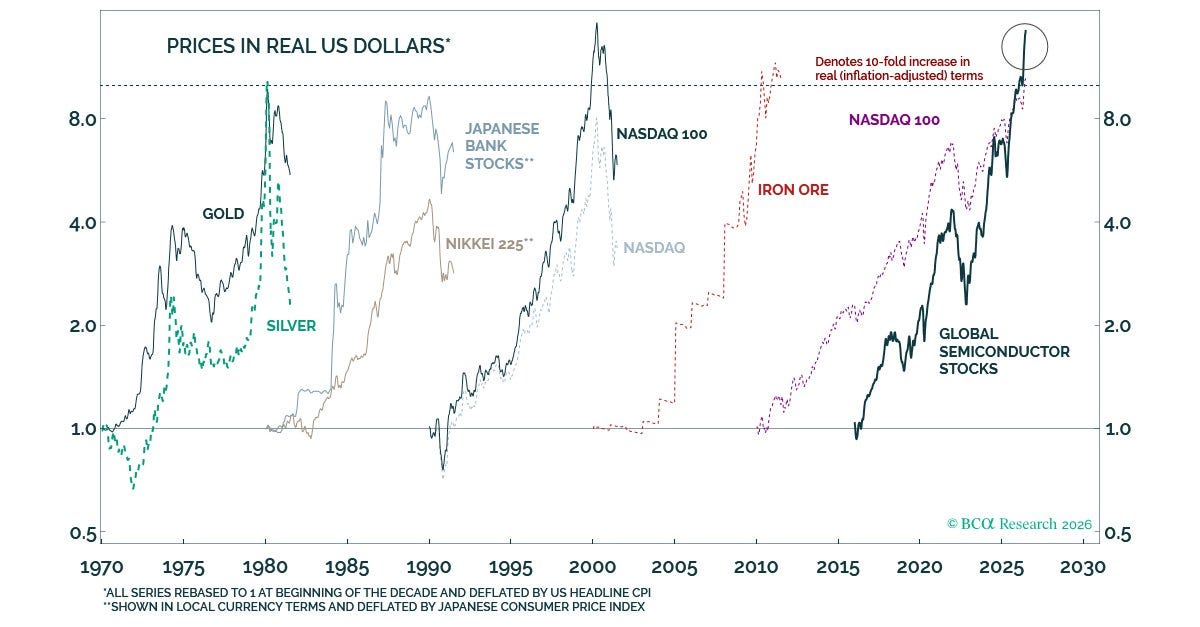
6. Bubble Vision: one clue that you’re in a major bubble is prices going up 10x in real terms. For global semiconductor stocks they’ve already leaped that hurdle. Similar to some of the other warning signs we’re seeing like expensive valuations and record high allocations, this is not a tactical risk flag, but it tells us a lot about the forward-looking risk setup, and that we should be thinking about downside protection and how to spot (+what to do about) the downside when it comes.
Source: @BudaghyanArthur
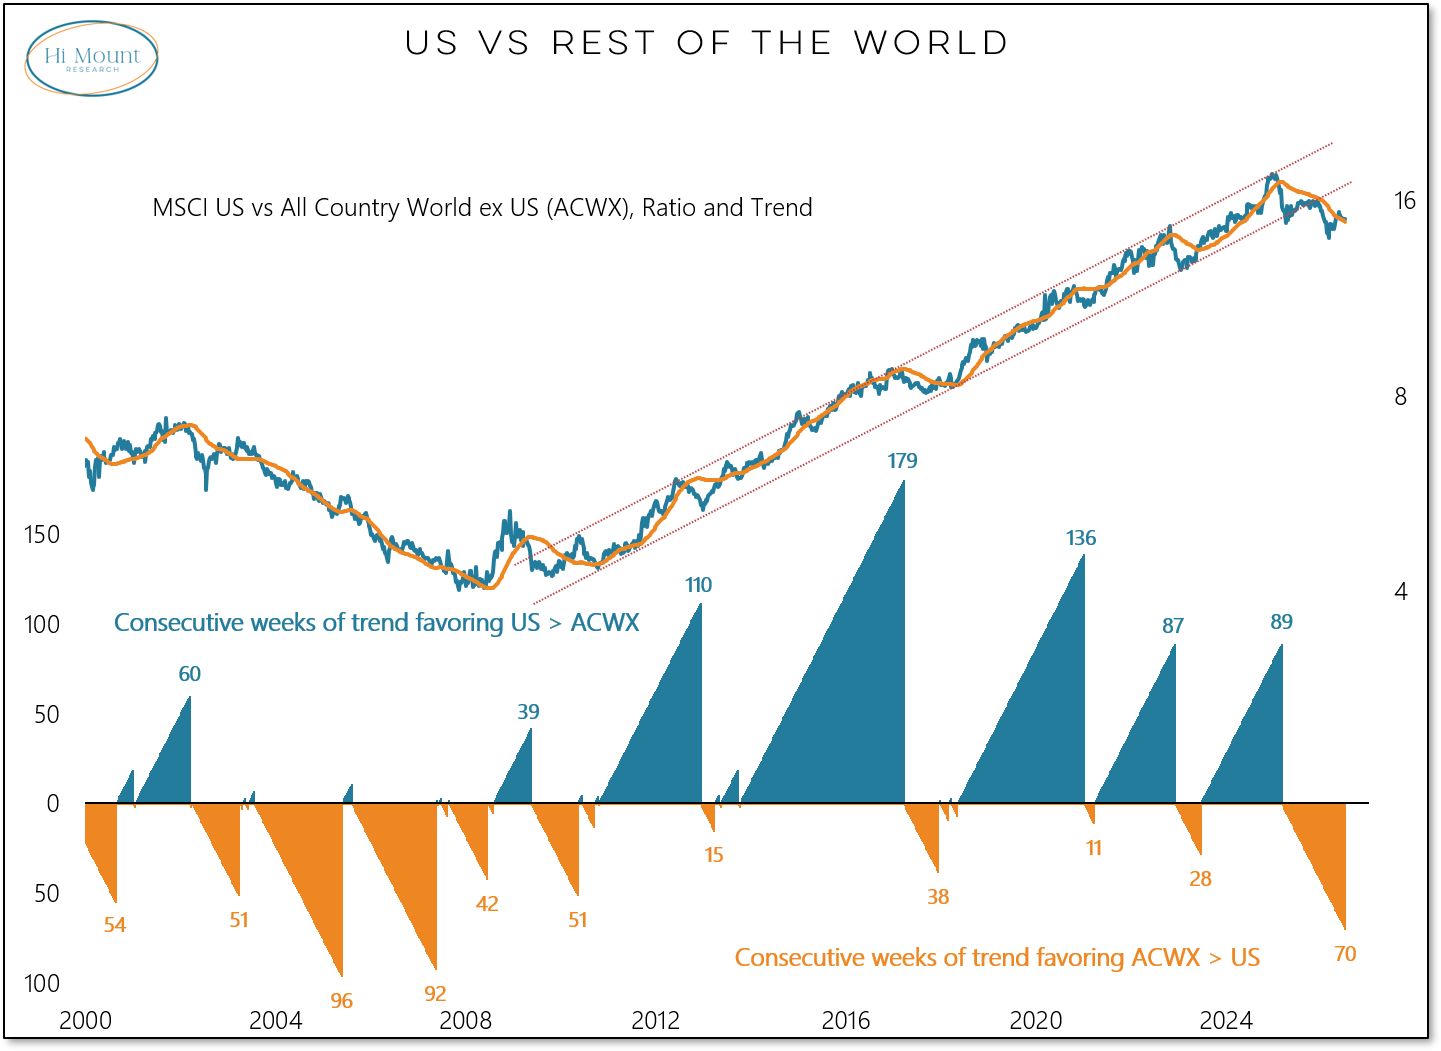
7. US vs Global Stocks: moving on, one very interesting development is the apparent persistence in global outperforming US since the turning point in 2025, this represents a major trend change, as Willie notes: “The secular trend in favor of the US that emerged coming out of the Financial Crisis has been broken.”
Source: Willie Delwiche
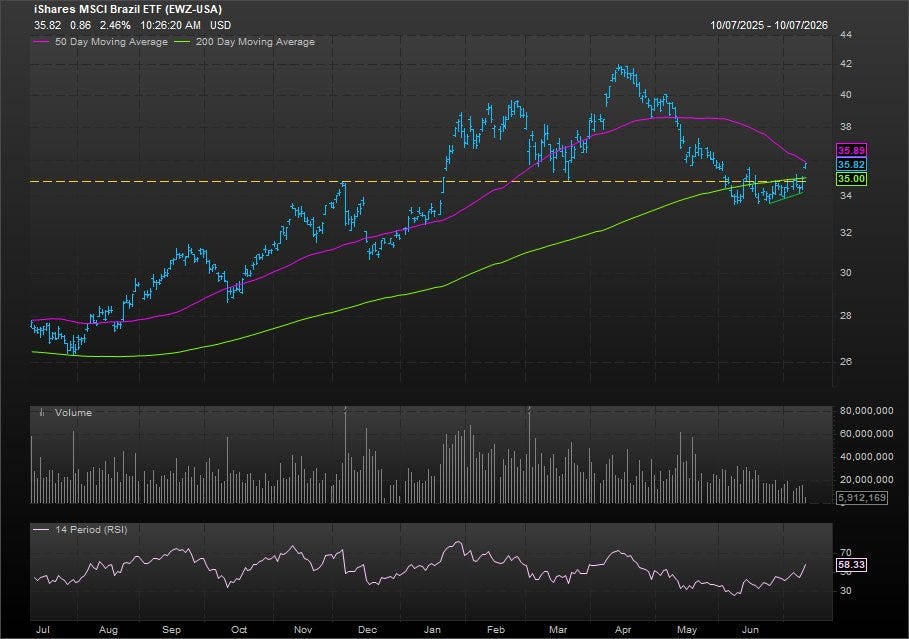
8. Brazilian Breakout: on the global front, this one caught my eye; after a period of correction and consolidation Brazil looks to be attempting a breakout.
Source: @davevermilion
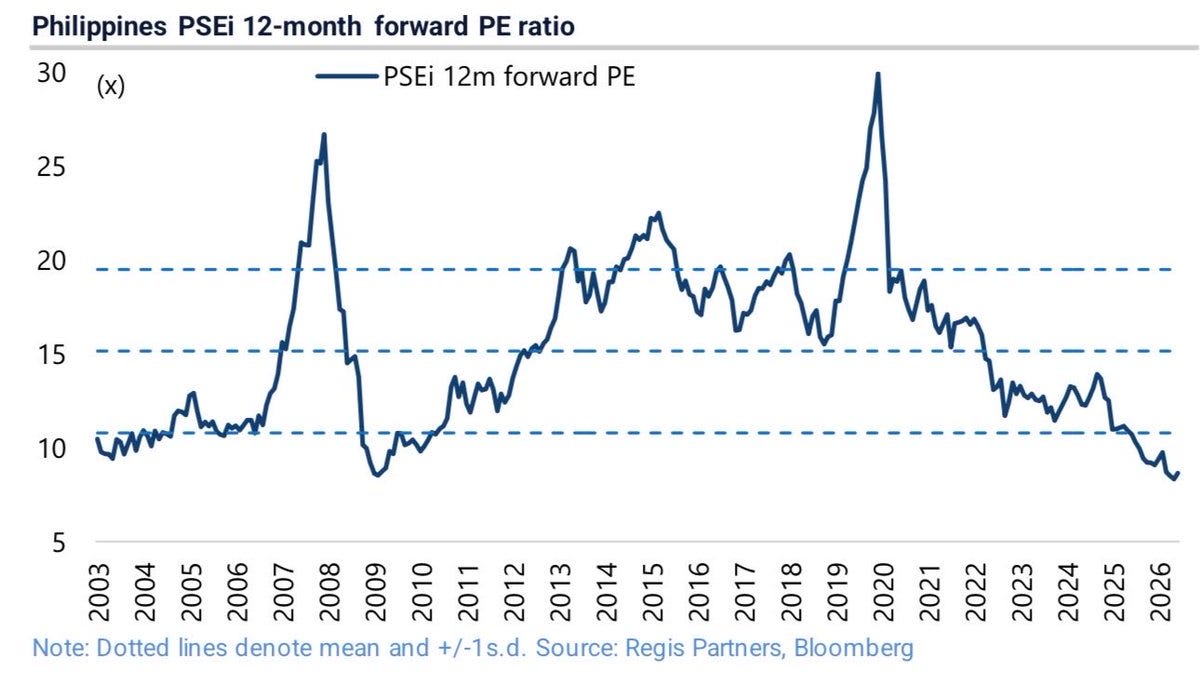
9. Philippine Deep Value: and another intriguing chart, Philippine stocks are trading on record low forward PE valuations.
Source: @MikeFritzell
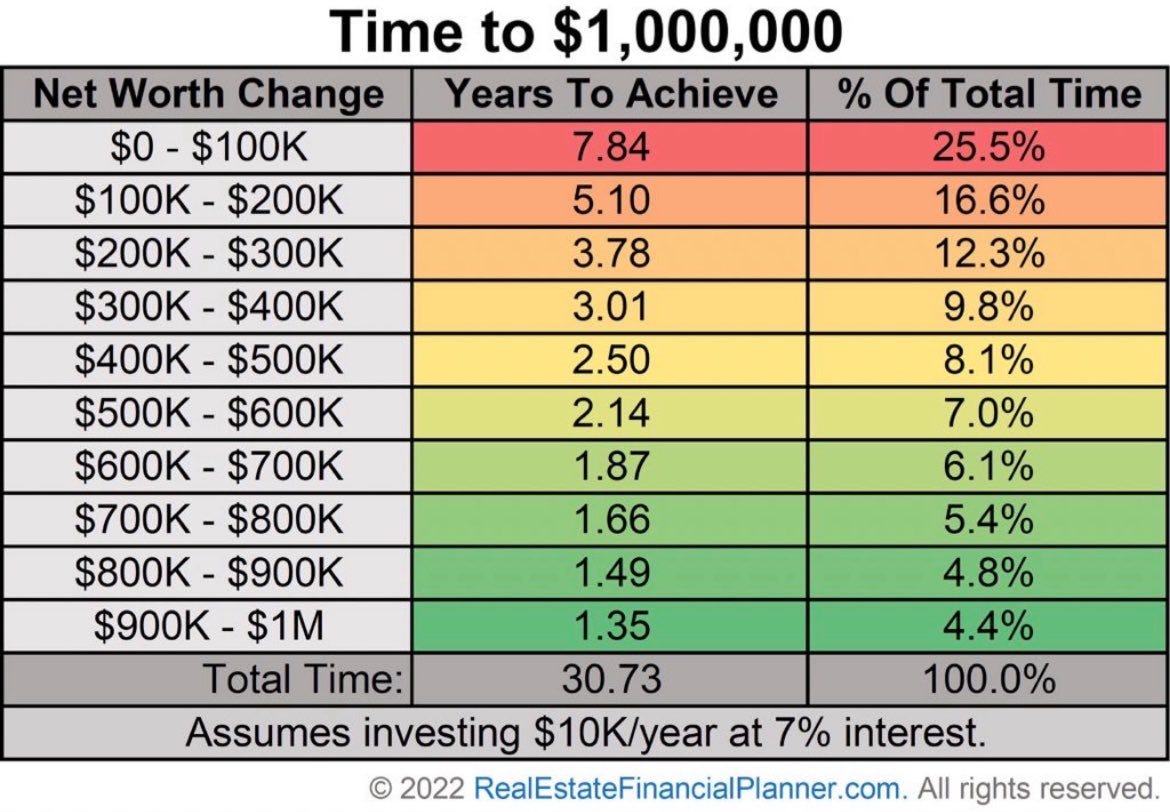
10. Time to 1 Million: this table shows how long it takes to get between each 100k increment step on the journey to $1million (assuming $10k invested each year with 7% interest) — thanks to compounding, most of the work and time is spent in the early stages: e.g. “the first 300K is 50% of the way to a millionaire”.
Source: @Investmentkage via @DividendGrowth
Thanks for reading, I appreciate your support! Please like/share/comment.
Portfolio Strategy Notes — Unsafe Investing
Echoing on the allocations theme, it’s interesting to note how investor allocations to cash and bonds are right at the bottom end of the historical range. And even within equities, the market cap weighting of defensive stocks is also at record lows.
In other words, the typical investor has a much lower portfolio weighting than usual to safe/defensive assets.
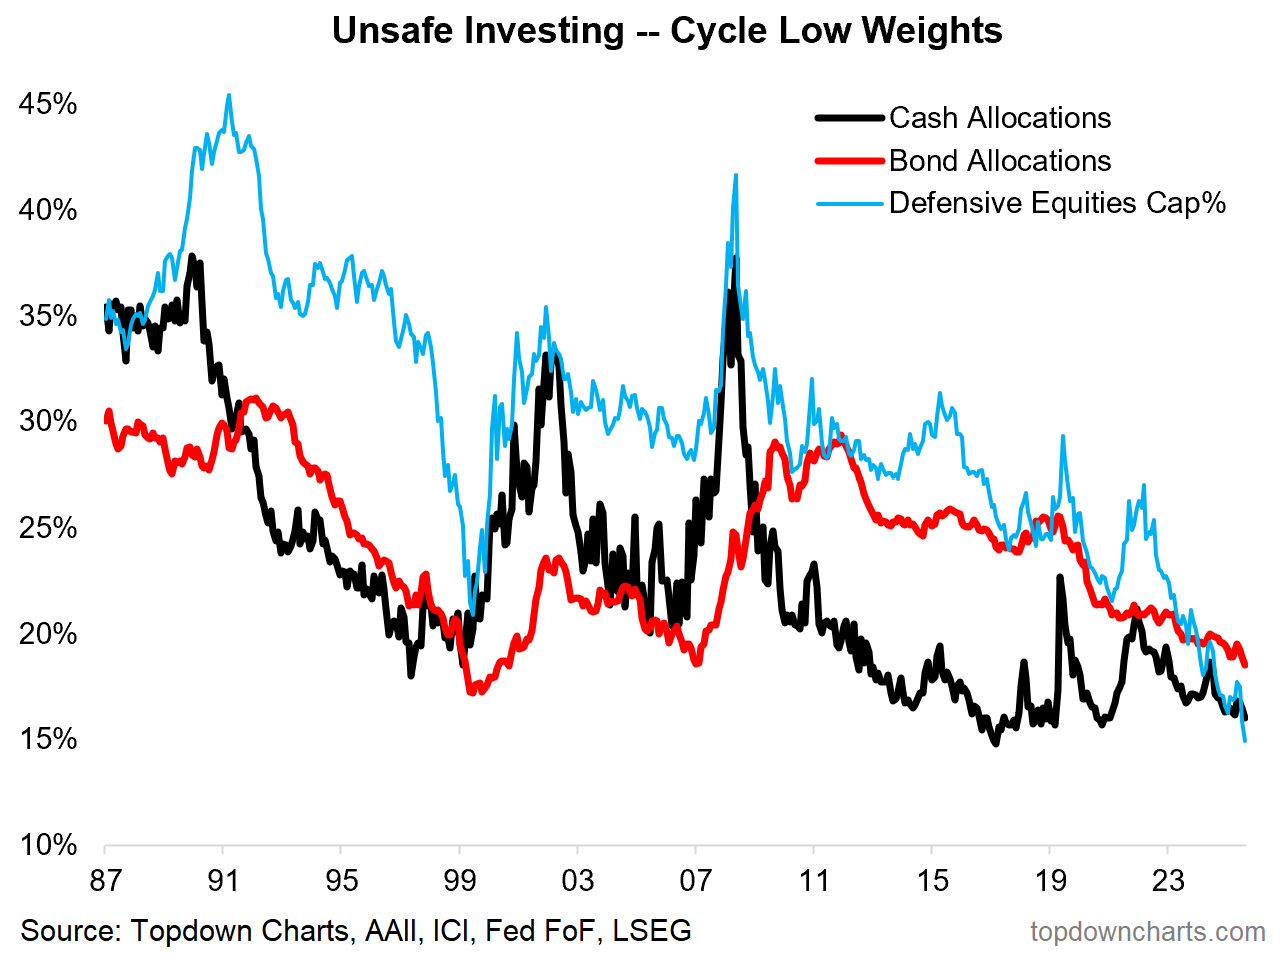
This is exactly what you would expect to see in the later stages of a raging bull market in equities, and to be fair it has (so far) made more sense to hold more equities (and more growthy/risky equities).
But naturally this leaves investors unprepared and ill-positioned for the next stage of the cycle. A bubble-burst or garden variety bear market will do more damage than usual to portfolios and investor wealth levels given the much greater exposure to growth assets and much smaller weighting than usual to defensive assets.
So again, I think it will pay to have a good ponder on process and plans around this.
—
Best wishes,
Callum Thomas
Founder & Editor of The Weekly ChartStorm
and Head of Research at Topdown Charts
Twitter/X: https://twitter.com/Callum_Thomas
LinkedIn: https://www.linkedin.com/in/callum-thomas-4990063/
In case you missed it, also see last week’s edition:


.
Weekly chartstorms are useful as constraint maps. Sticky inflation or a fiscal surprise can reprice path odds faster than the next candle can manage them.