

Note: this is a new series for free subscribers and is intended to give an insight into the work that goes into The Weekly ChartStorm + provide a little further explanation on charts and concepts.
I sent a survey around yesterday asking what people think will be the biggest surprise for investors in H2 —and so far the top-voted candidate is “AI Bubble Burst”.
Looking at some of the recent price action (e.g. the KOSPI is down -20% off the peak, the US SOX putting in a major topping pattern, Japan’s Softbank down -33%), I think they might be onto something.
Which brings us to this week’s chart.
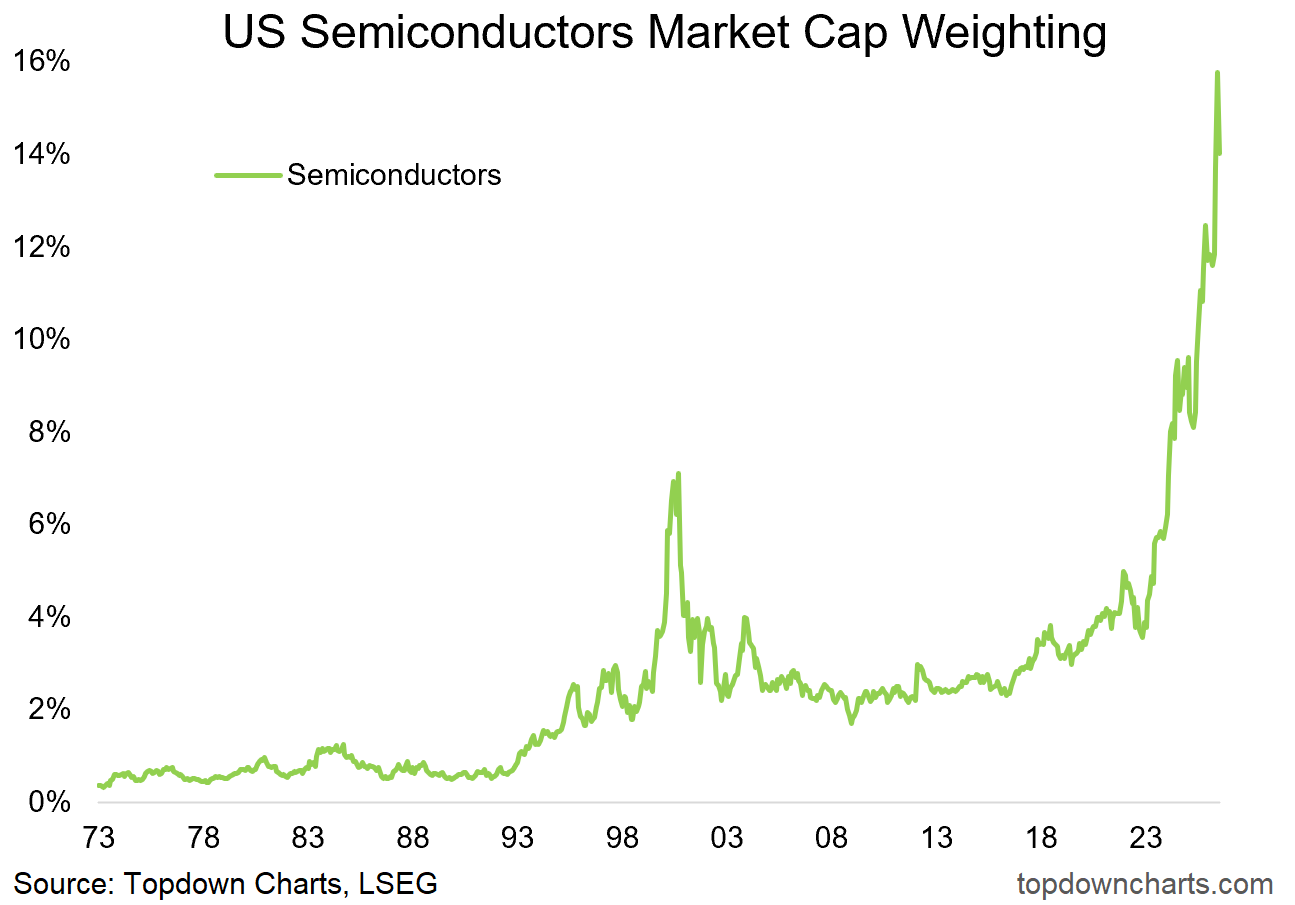
It’s an update of the US Semiconductors market cap weight chart, which has pulled back from record highs.
When I last featured this chart I mused: “semiconductors are in the bubble phase of the bull market (which is dangerous for both bulls and bears alike!)”
That remains true, and the danger is that we are in the early stages of a bubble burst (they start with initial weakness; slowly at first, and then all of a sudden).
But at the same time, in the past 2 years we have seen 2 periods of pullbacks which basically turned out to be “bull flags” (is this third time’s a charm?).
I would say it’s a timely juncture to review risk management plans and investment process, because at some point the old pattern of buy the dip will be faced with ever deeper dips…
Bottom line: AI bubble bursting risk is elevated; monitoring the situation.
p.s. yes —I will be digging deeper and updating on this chart/issue in future editions of The Weekly ChartStorm, so stay tuned!
Global Bubbles — KOSPI
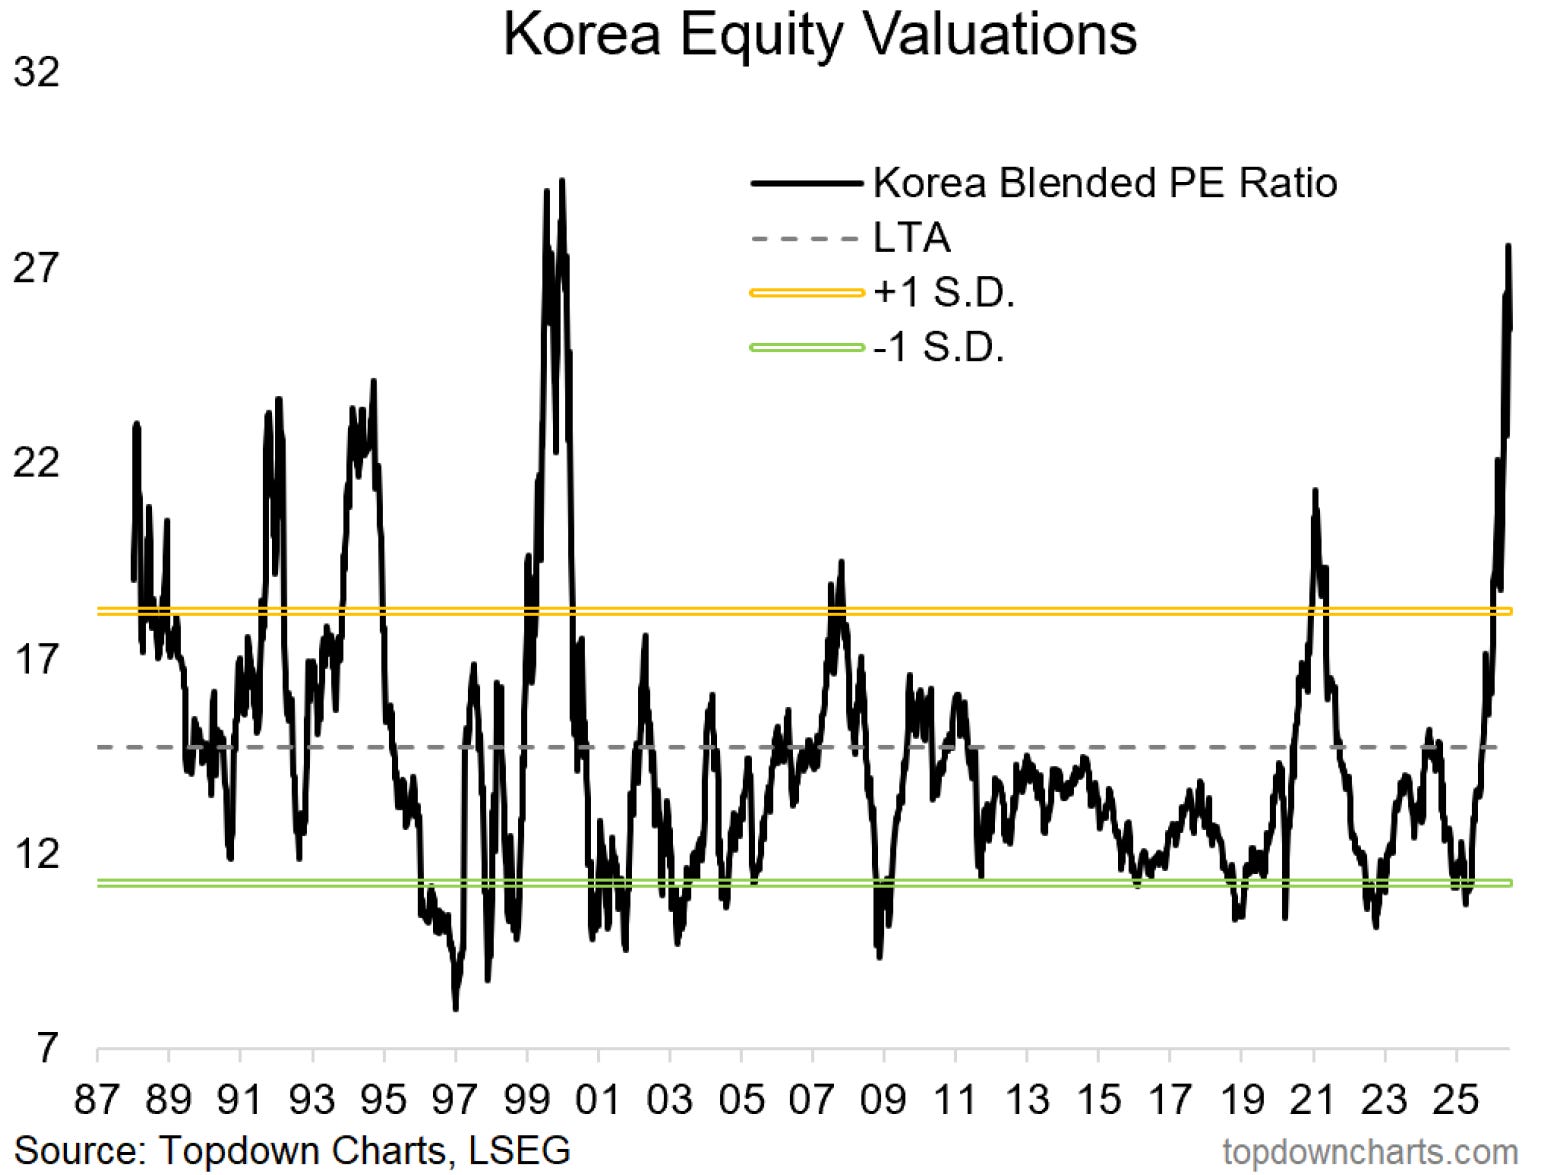
Korean equities are one key example of the global proliferation of AI bubblets.
Valuations have surged to record highs (as shown below), and meanwhile inflation risk is in alert mode in South Korea (general inflation was already trending up, and now PPI inflation + property price growth are surging); a pivot to rate hikes by the BOK (16th July) likely only piles on to the initial weakness we’ve seen in the KOSPI (alongside any doubts or idiosyncratic issues owing to AI).
A steeper correction in Korean stocks would likely rattle all of global equities, and logically spillover to emerging markets and US tech stocks. So it is one of the key risks I’m monitoring over at Topdown Charts.
Thanks for reading!
For more info on the Weekly ChartStorm service see:
Lastly, be sure to reach out at any time if I can help with anything. I promise to leave no questions unanswered and no problems unsolved.
—
Best wishes,
Callum Thomas
Founder & Editor of The Weekly ChartStorm
and Head of Research at Topdown Charts
Twitter/X: https://twitter.com/Callum_Thomas
LinkedIn: https://www.linkedin.com/in/callum-thomas-4990063/
Already a paid subscriber?
Log-in and read the latest report here:

.