Weekly S&P500 ChartStorm - 1 March 2026
This week: monthly charts, rotation, value vs growth and macro/fundamentals, tech capex, AI effects, space sector, downside risks for the stockmarket...

Welcome to the latest Weekly S&P500 #ChartStorm!
Learnings and conclusions from this week’s charts:
The S&P500 dropped -0.87% on the month in February.
(yet the equal-weighted version gained +3.4% in Feb)
(rotation remains a key theme)
Value vs growth rotation has clear fundamental support.
There are still some compelling causes for optimism.
Overall, the rally in cyclicals/value is helping offset tech-troubles (aka bullish rotation), and there is clear compelling macro-fundamental support to rotation (along with the cooling-off from tech/AI hype). We’re probably seeing a classic case of overinvestment in capex on the AI front, but it’s not all bad news…
1. Happy New Month! The S&P500 closed down -0.87% for February, placing it marginally up +0.5% YTD. The equal-weighted version however gained +3.4% (and is up +6.8% YTD) — meanwhile the Nasdaq dropped -2.3% in Feb (down -1.1% YTD).
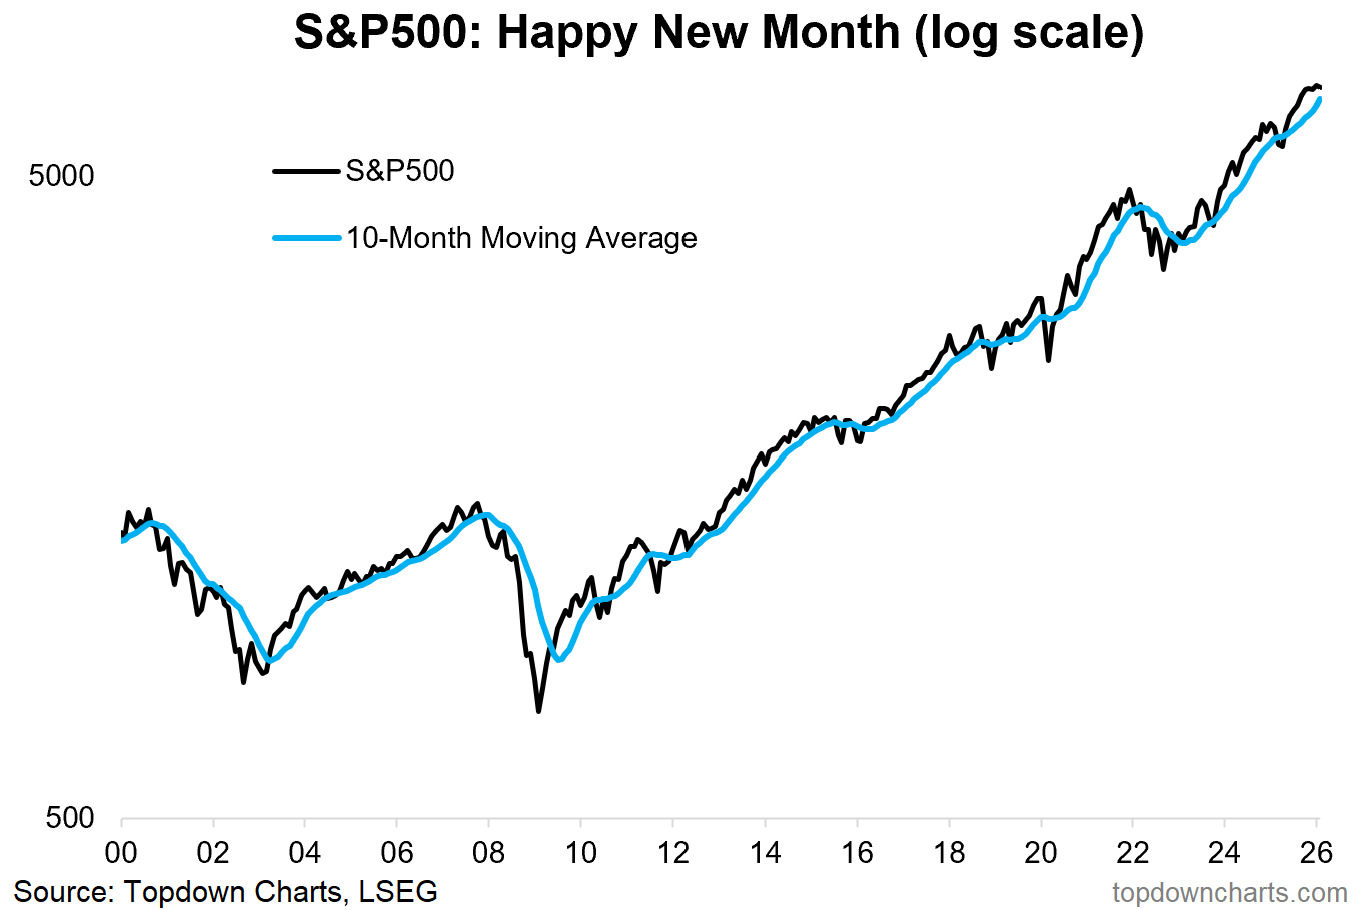
Source: Topdown Charts
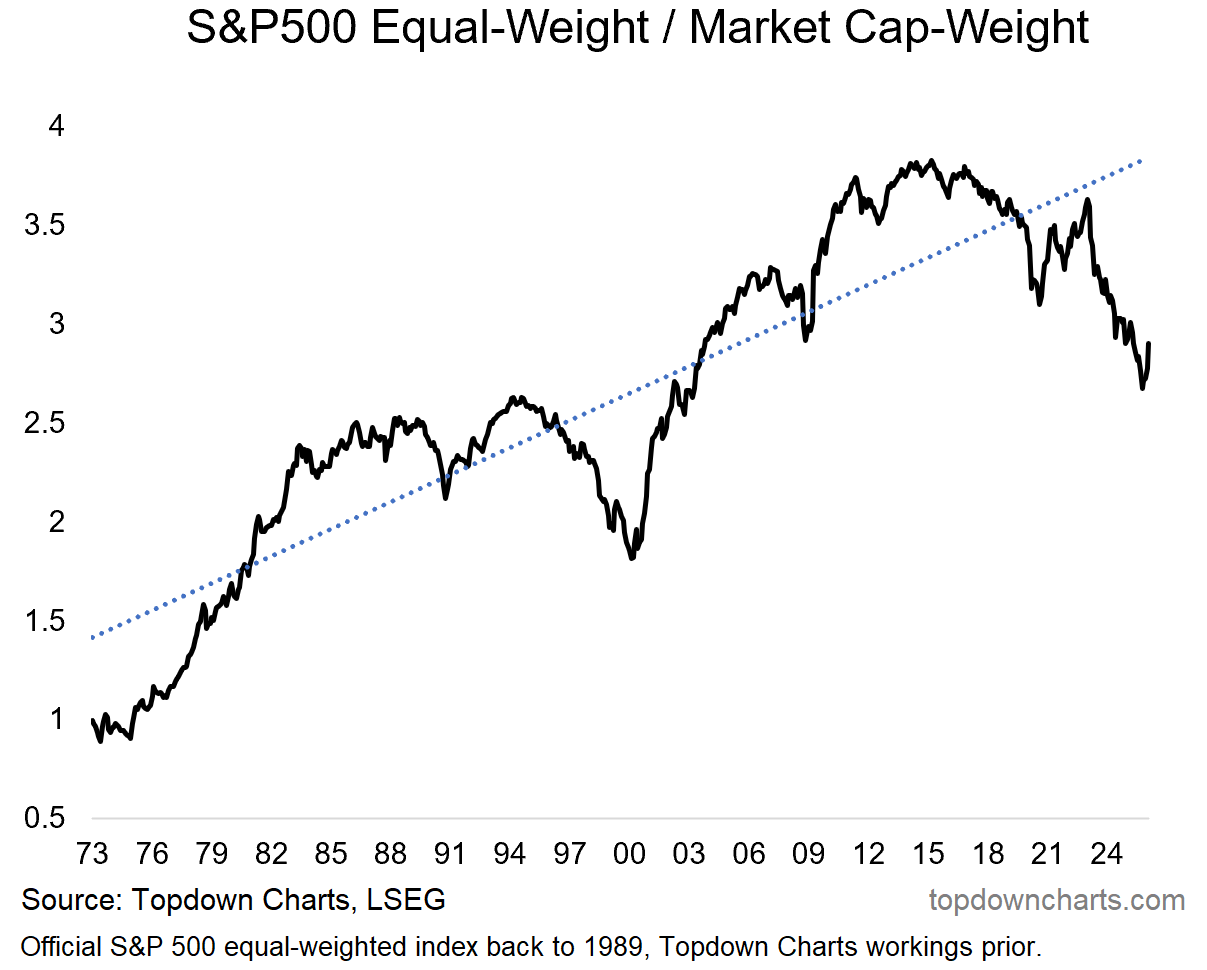
2. S&P500 Equal vs Cap Weighted — Rotation: as such, the equal-weighted vs cap-weighted relative performance line has surged higher after previously reaching an extreme divergence from trend. This is a classic rotation trade and it reflects both the large-cap growth/tech side of things running into issues as well as the smaller/cheaper cyclicals seeing better prospects.