

Here’s a quick “Off-Topic ChartStorm” on (US) Tech Stocks.
Unlike the usual Weekly ChartStorm (which focuses on the US stock market and related issues), the Off-Topic ChartStorm is a semi-regular focus piece with deep-dives into topics spanning macro, markets, stocks, commodities, regions, and various other issues of interest.
Learnings and conclusions from this session:
US tech stocks have peaked (+rolled over vs US non-tech, global tech).
Sentiment is slumping from previously extreme bullish/complacent.
Positioning has also peaked, early signs of rotation showing up.
Valuations are ticking down from extreme expensive levels.
Stretched valuations reflect strong earnings (but that’s also a risk).
Overall, tech stocks have peaked for now. The problem is they’re coming from a starting point of overvalued and overhyped. The benign/bullish outcome would be a plateau in tech and bullish rotation (into traditional cyclicals, global), while the bearish outcome would be outright downside (and rotation into defensives). This report looks at the evidence so far and weighs the next steps…
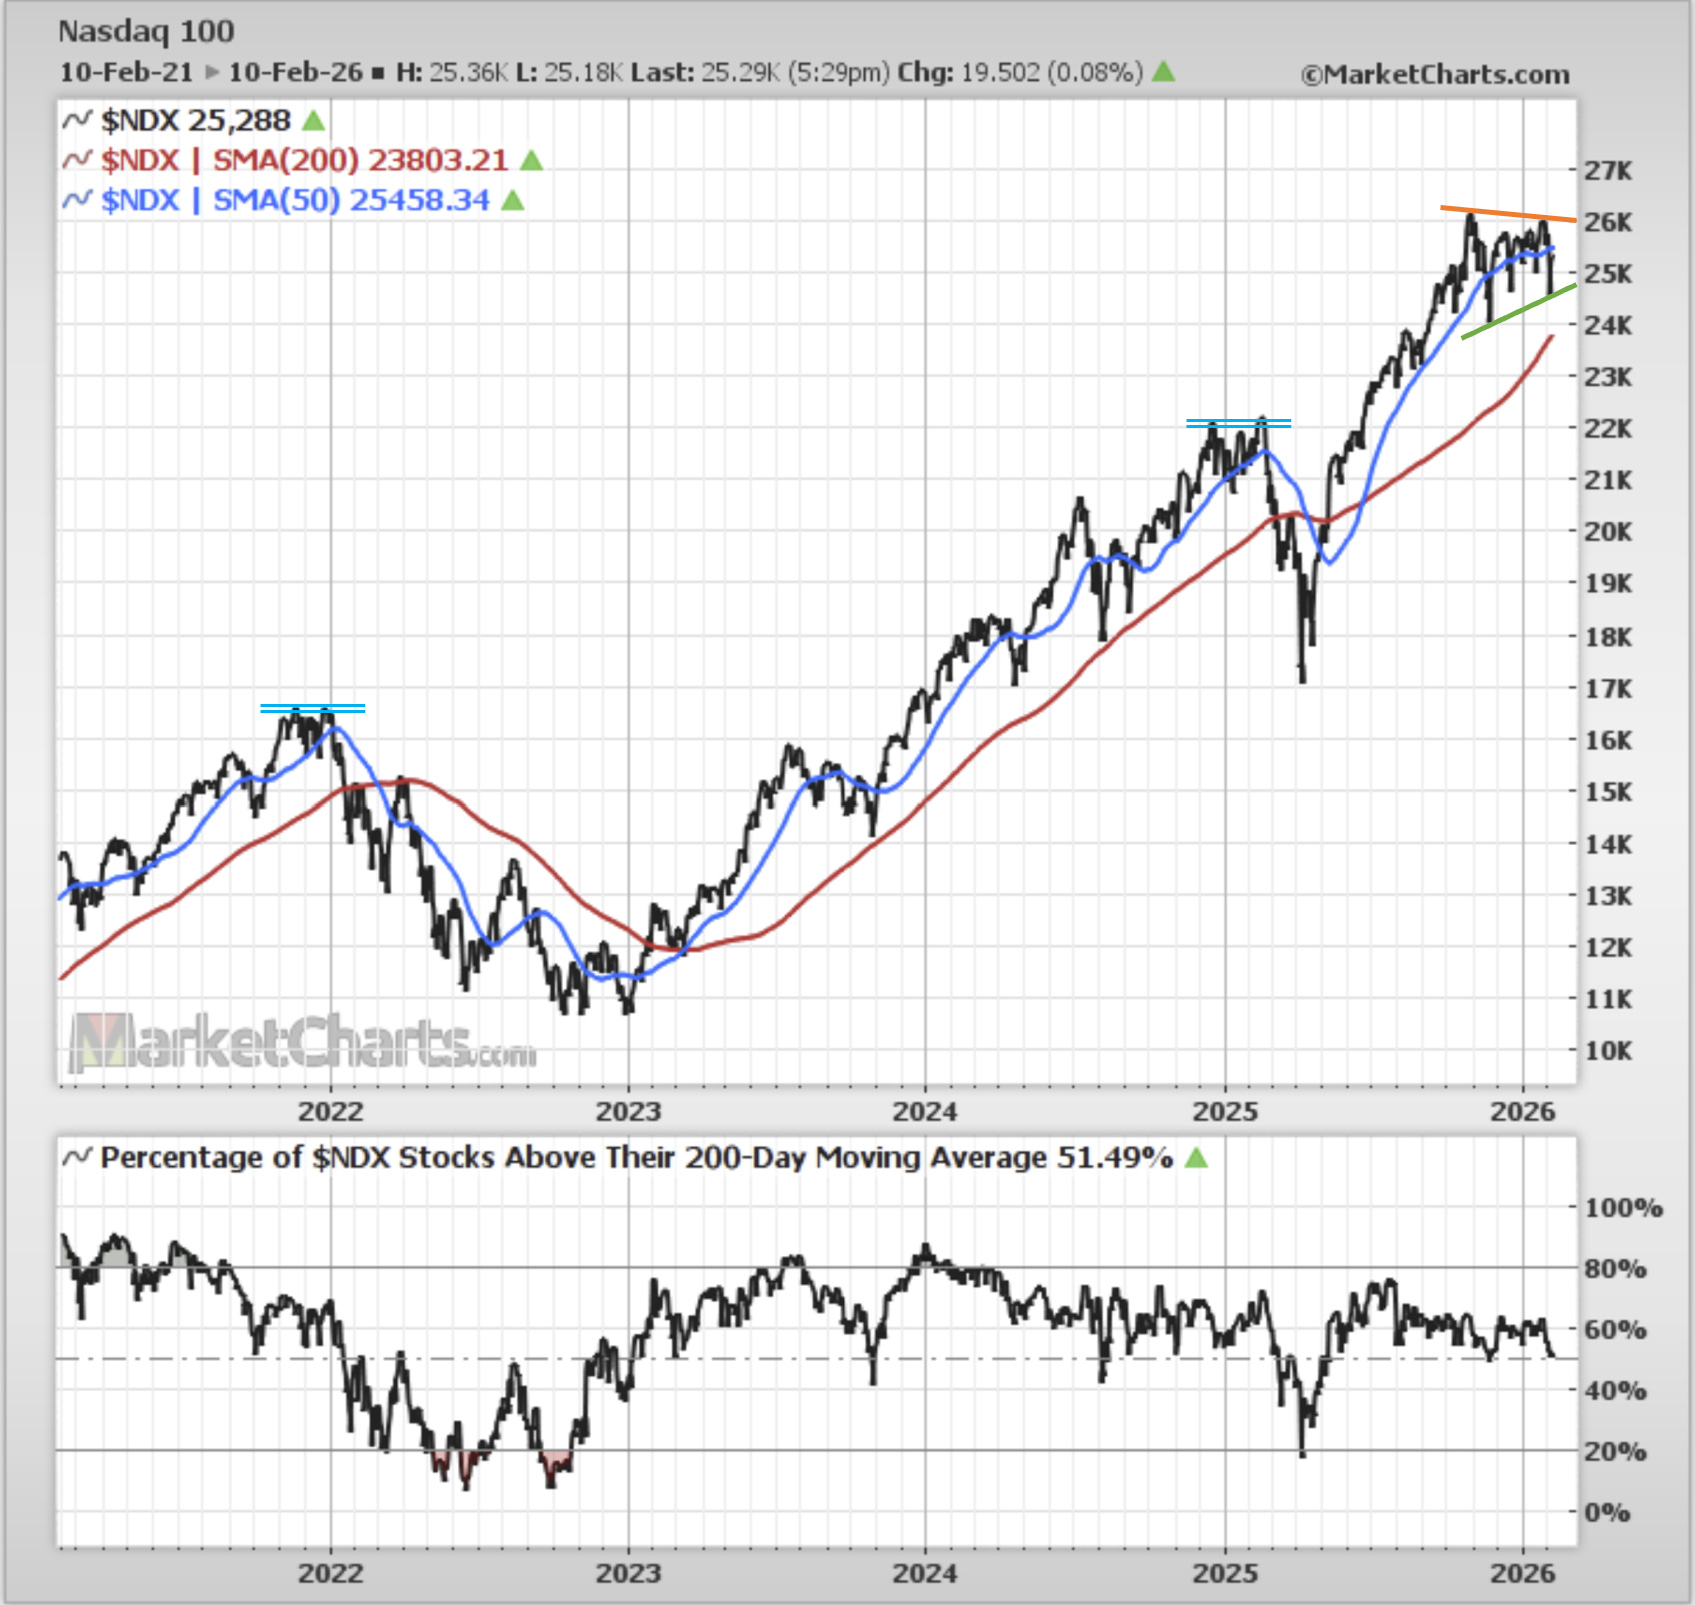
1. Tech Top (Absolute Terms): as mentioned a couple of weeks ago, tech has topped.
The Nasdaq 100 peaked on the 29th of October 2025, and has not yet made any further new highs since. Perhaps the only consolation is that it’s still technically in an uptrend (tracking above its upward sloping 200-day moving average), and most importantly — it has not outright broken down yet.
2. Tech Top (Relative Terms): on a relative basis US tech stocks have not only peaked but broken sharply lower vs non-tech stocks.
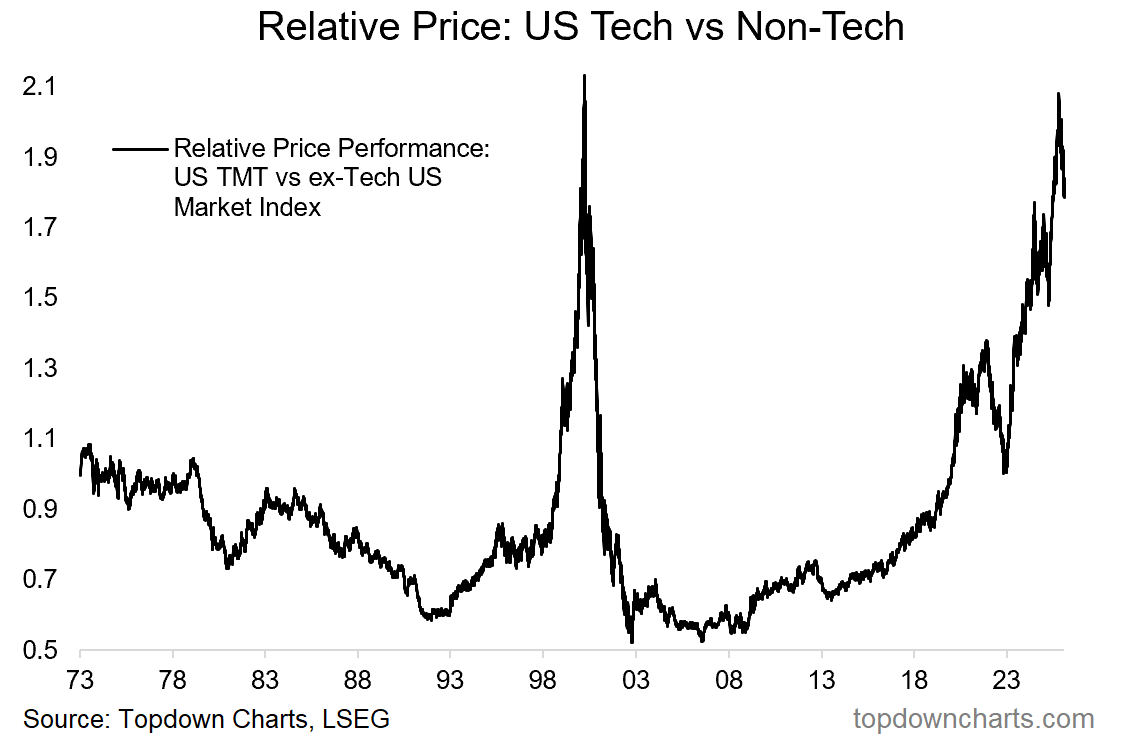
Source: Topdown Charts
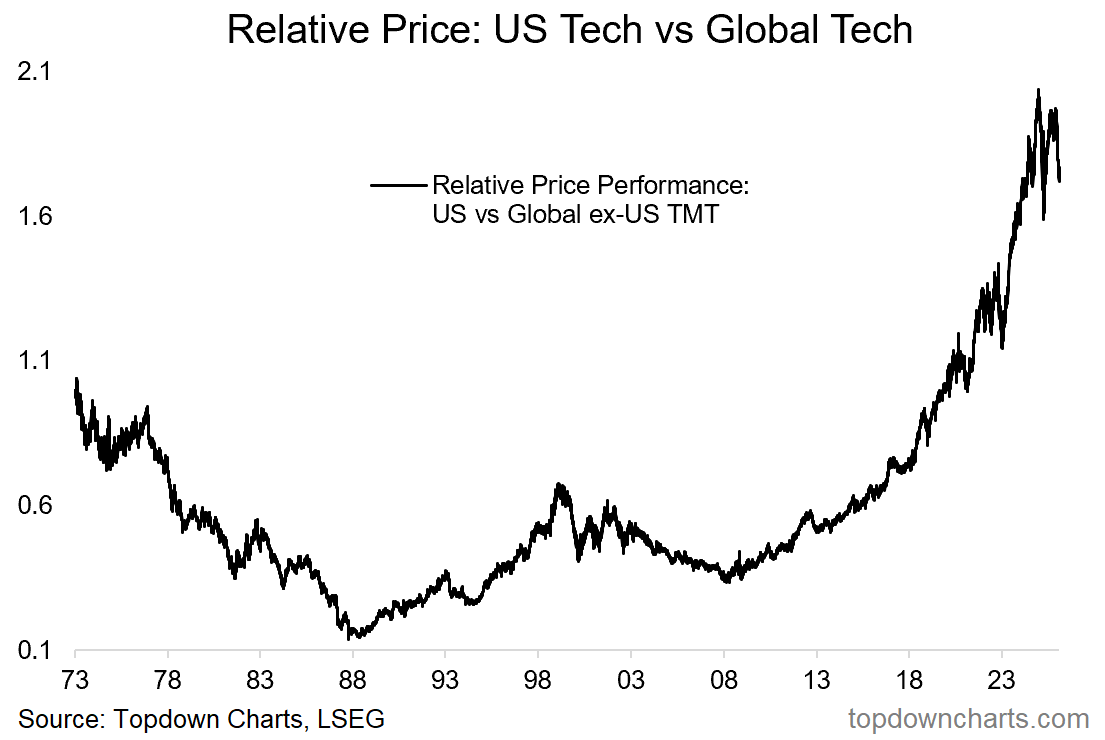
3. Tech Top (vs Global): US tech stocks have also peaked relative to Global (ex-US) tech stocks (and with a confirmed lower high).
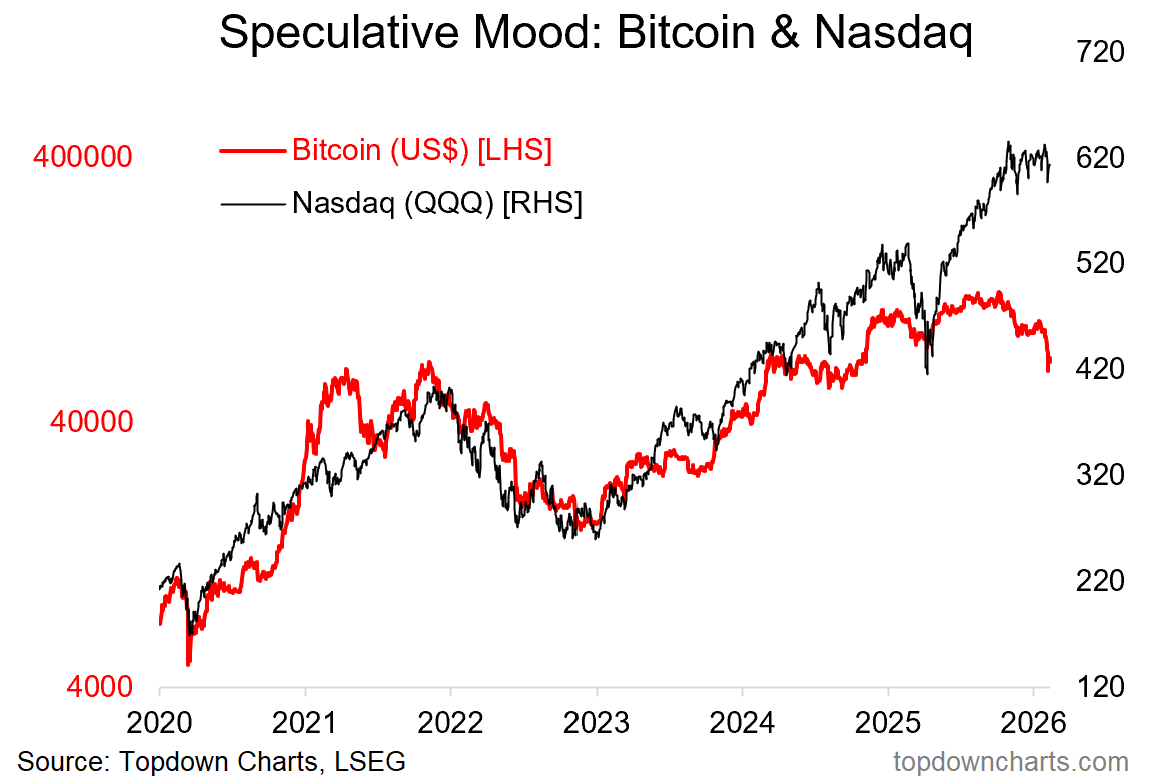
4. Tech Vibe Shift: we’ve also witnessed some brutal price action in the Nasdaq’s old traveling partner (Bitcoin). As a barometer of tech/speculative sentiment, this is clearly painting a gloomy picture.
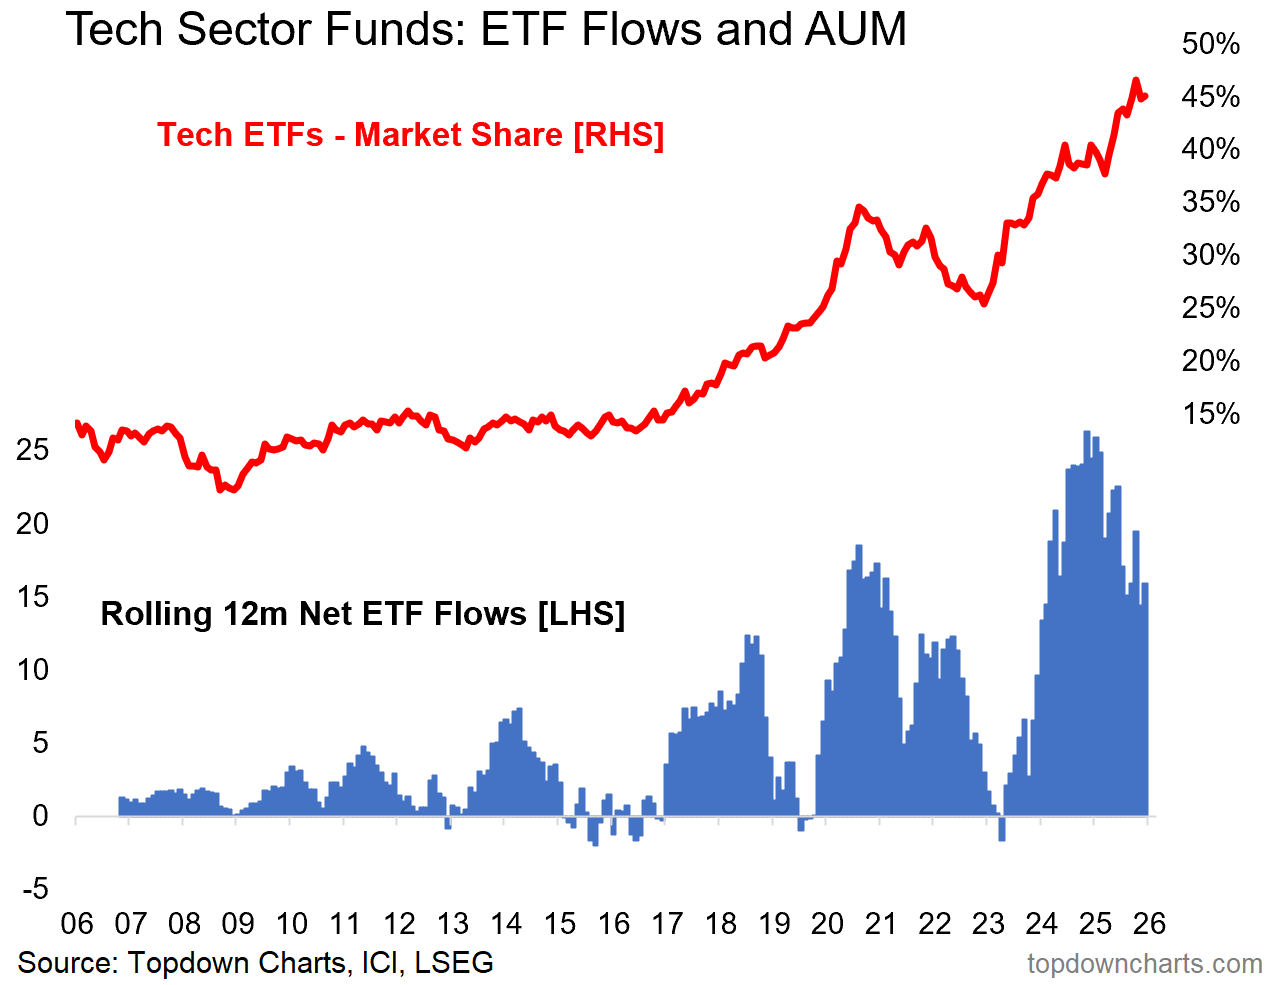
5. Flows & Positioning: similarly, tech sector implied investor allocations have peaked after reaching a record high (not far off 50%(!)), and rolling annual net flows to tech actually peaked at the end of 2024. So it’s a picture of former extreme-bullish sentiment peaking and rolling over (a classic bearish technical signal).
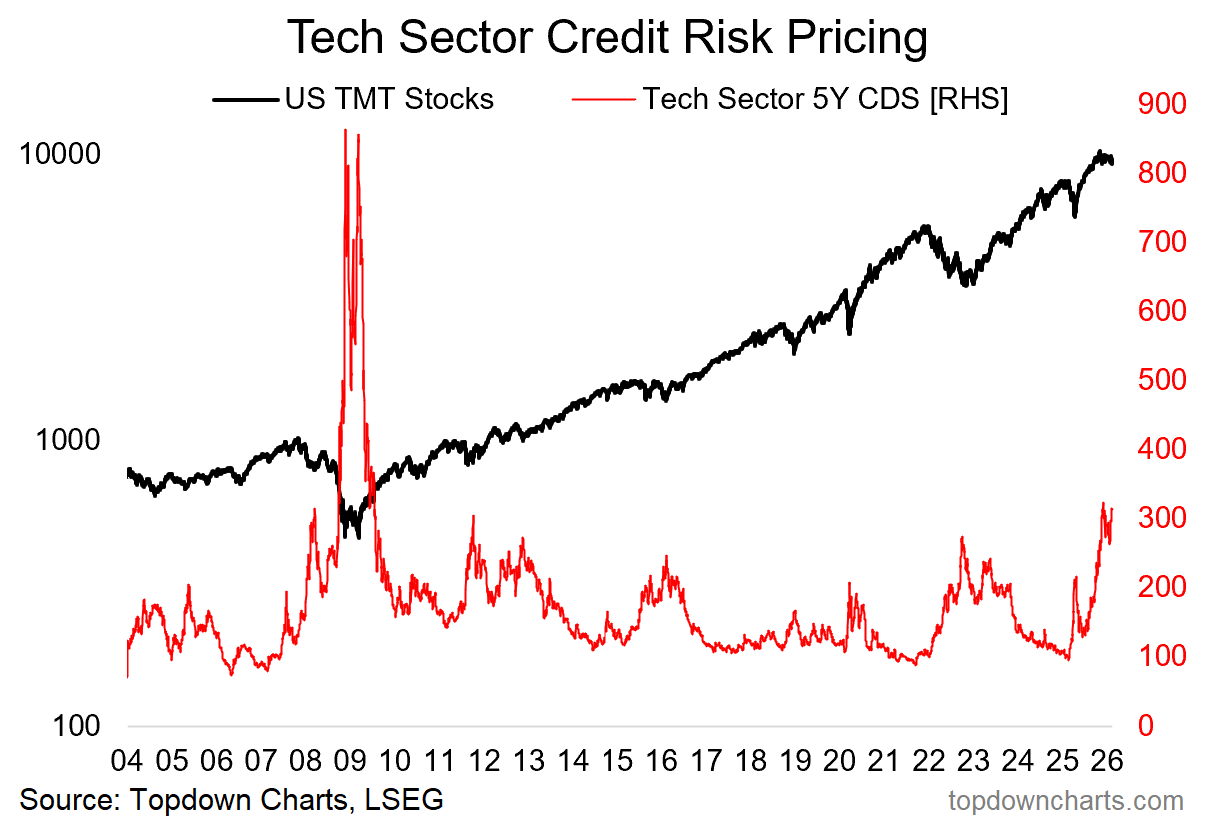
6. Tech Credit: another intriguing datapoint has been the surge in credit risk pricing for the tech sector. It was all fun and games with AI hype when it was just equity markets, but now that credit markets are involved it doesn't seem so fun anymore…
(that said, spikes in credit risk pricing like this can serve as contrarian signals)
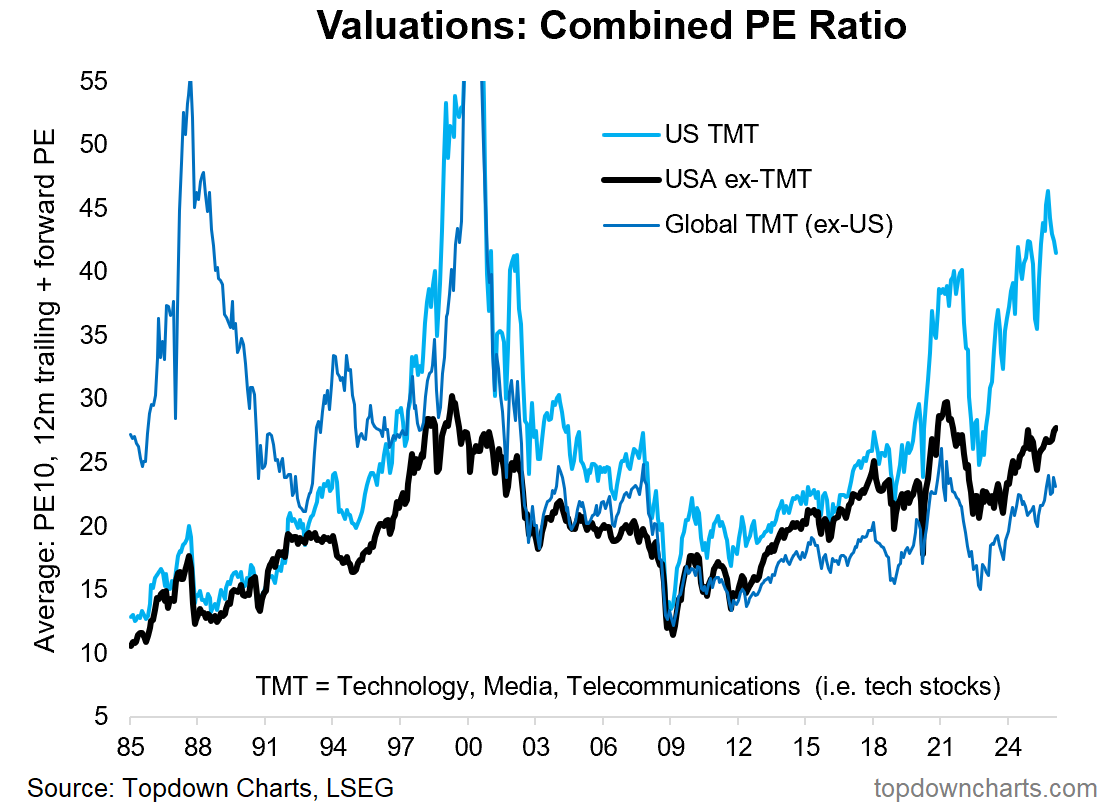
7. Valuations: all of this (weakening technicals, bearish sentiment signals) is set against a backdrop of expensive valuations. US Tech stocks have been bid up to extremely expensive levels vs history, vs non-tech, and vs global tech.
8. Different This Time: bulls will probably push back about now and say that it’s different from the last time valuations were this stretched because earnings are on the rise and there’s a fundamental backing to it. But I don’t think we need to invoke “just like dot-com” to highlight the risks here, and even if the dream run in tech stocks over the past decade has been backed by rising earnings, you can still have valuations overshoot and investor sentiment get carried away.
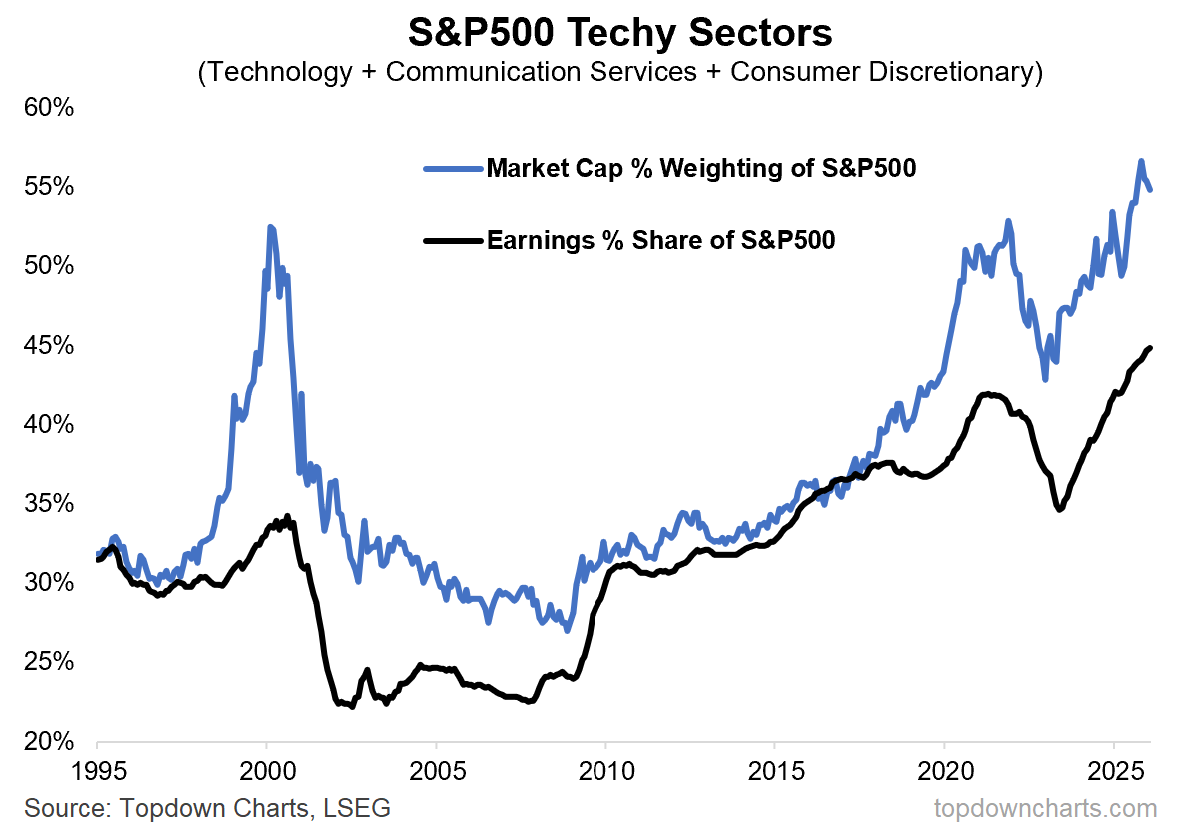
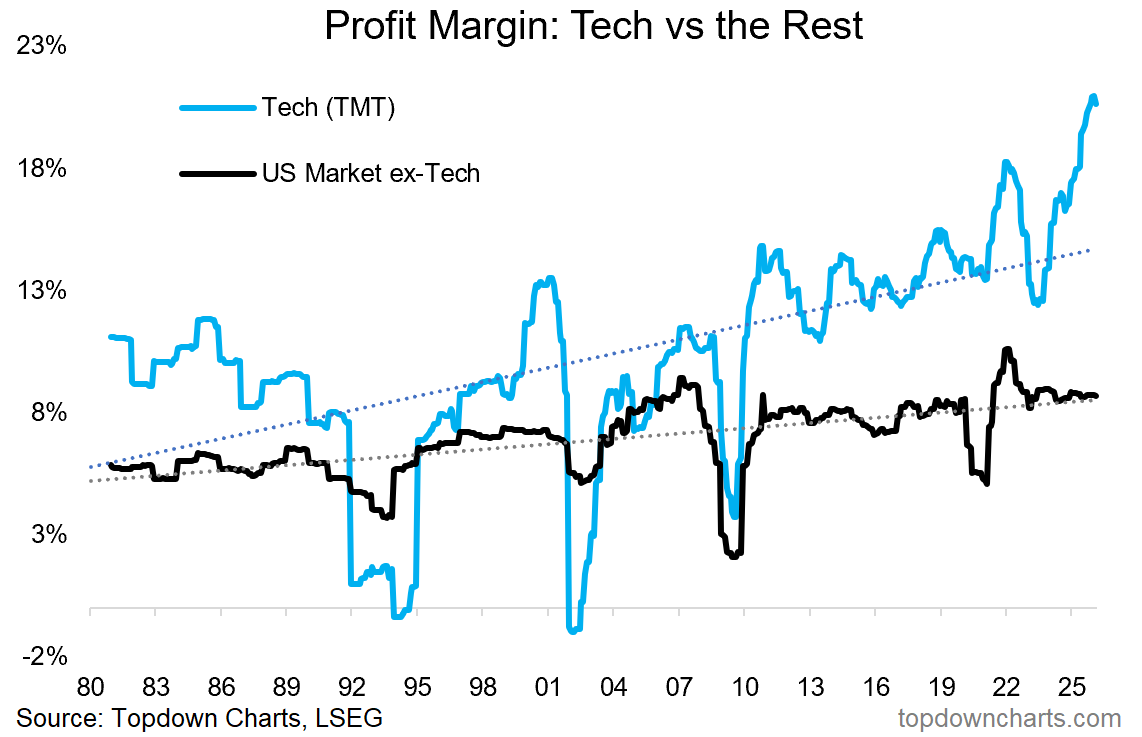
9. “Expensive for a Reason” for instance, bulls can definitely point to the exceptional profitability of US tech stocks, as illustrated in the chart below (+strong trend in trailing earnings + expectations of continued strong uninterrupted earnings growth into the future).
But this also presents a vulnerability. If extremely high tech stock valuations reflect strong profitability, what if profit margins peak and rollover from cyclically extended levels? And if expensive valuations reflect the expectation of strong uninterrupted future earnings growth, what if earnings plateau? or even worse, what if earnings were to decline?
The big vulnerability here is that you have stretched valuations underpinned by stretched profit margins. Even if you get only a mild cyclical downturn at some point, that whole confidence structure could come crumbling apart.
10. So what’s next? this chart basically lays out the best and worst case for what happens after the peak in tech. It shows tech stocks’ market cap weight rolling over from record highs, cyclicals’ weight ticking up off the lower end of the range, and defensives’ up from record lows. And therein lie the clues for the two key scenarios of how the tech-top might unfold from here:
Bullish/Best Case = [Bullish Rotation] in this scenario tech just peaks and plateaus; shifts into more of a ranging regime, or at least a more gradual and volatile up-trend — but investors basically give up on tech and chase after better returns in Traditional Cyclicals (which is entirely possible as a global growth reacceleration will disproportionately help traditional cyclicals like industrials, materials, energy, financials, and global stocks). Under this scenario the market as a whole could continue to move higher, or sideways at worst.
Bearish/Worst Case = [Bearish Rotation] the worst case would be that tech rolls over into a bear market (e.g. as a result of declining valuations, collapsing sentiment, and/or deterioration in earnings/fundamentals). In that case you’d likely see rotation out of tech and into defensives, and the stockmarket as a whole declining.
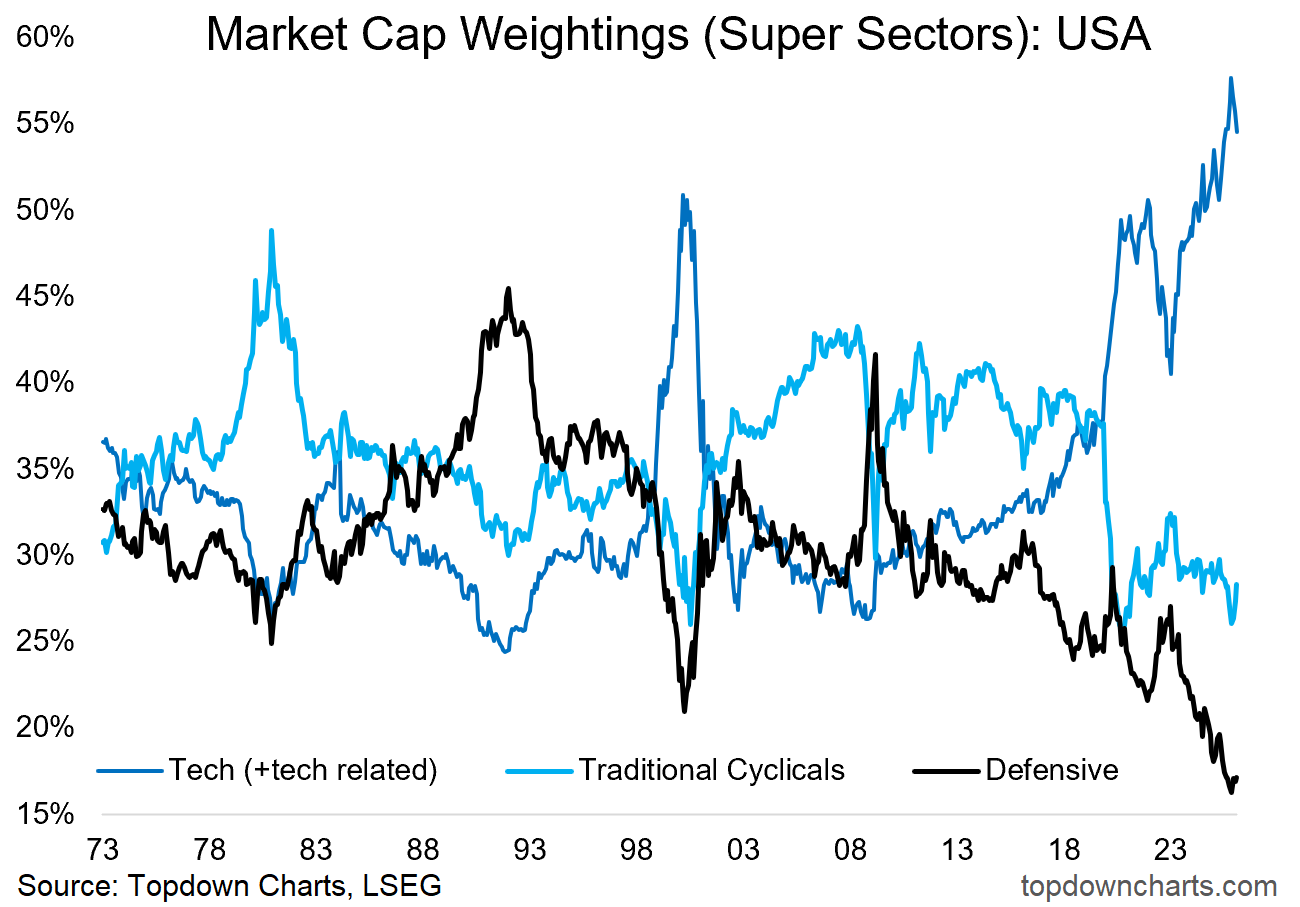
n.b. “Super Sector” definitions: Tech+ (technology, communication services, consumer discretionary), Traditional Cyclicals (industrials, materials, energy, financials), Defensives (utilities, healthcare, consumer staples)
…well ?
The next logical question would be: “so which one is it??” — all the evidence I see so far points to the former (bullish rotation), and I think there is sound macro/value/technical reasons to expect a continuation of that dynamic.
The Defensives/Bearish rotation scenario probably only comes through if we tip over into recession, or some kind of shock rattles the system. From a practical standpoint I will be monitoring technicals first (a breakdown in QQQ would be a key trigger), credit spreads (for further issues in tech or spillovers), and earnings/macro (for a lead on the fundamental side of things).
I will update as usual in the regular Weekly ChartStorm when and if I see any of these warning signs or triggers show up, but for now I would be more focused on the upsides (bullish rotation, cyclicals, global) and staying data/facts/chart-driven as things unfold.
—
Best wishes,
Callum Thomas
Founder & Editor of The Weekly ChartStorm
and Head of Research at Topdown Charts
Twitter/X: https://twitter.com/Callum_Thomas
LinkedIn: https://www.linkedin.com/in/callum-thomas-4990063/
Other services by Topdown Charts
Topdown Charts Professional —[institutional macro/multi-asset research]
Topdown Charts Entry-Level Service —[entry-level version of the above]
Weekly S&P 500 ChartStorm —[US Equities in focus]
Monthly Gold Market Pack —[Gold charts]
n.b. also take a chance to review the latest edition (15th Feb) for further follow-ups on this issue: https://www.chartstorm.info/p/weekly-s-and-p500-chartstorm-15-february
Thank you for the interesting article. A question about the bottom-line: Can you point out one or more cases in the past where a sector experienced a mania/bubble of the scale (or close) as the recent TMT and then stayed up while other sectors caught up? feel free to look at places outside of the US. 2000 surely wasn't one example.