
Chart of the Week - Valuation Heights
Chart in-focus from the latest Weekly S&P500 ChartStorm

Note: this is a new series for free subscribers and is intended to give an insight into the work that goes into The Weekly ChartStorm + provide a little further explanation on charts and concepts.
A key theme from the latest Weekly S&P500 ChartStorm was that the Stockmarket is currently in the process of “letting-off steam” following the sharp rebound-rally.
Valuations were one key example of “steam” building up…
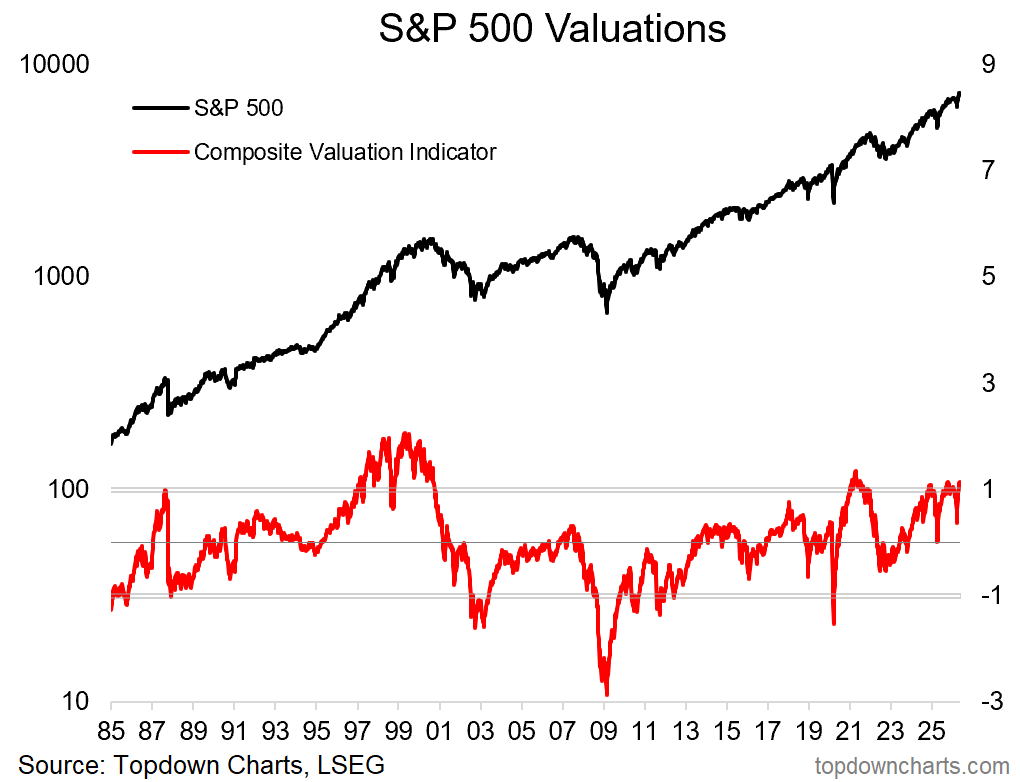
Bigger picture, we are in a cyclically overheated market, the various valuation indicators say it’s expensive, and that does create a risk of rapid resets and eventual valuation mean reversion.
This is the risky end of the cycle.
And before you tell me about AI buildout and all the rest of the good reasons why stocks are going up, I understand that, and so does everyone else, and let me assure you — there is always a reason.
Bulls, Booms, and Bubbles start with good reason, and end when things get unreasonable.
So, on the topic of today’s chart, are valuations unreasonable yet?
Objectively speaking, the composite valuation indicator below is in the risky/expensive zone. It’s from around these levels that the market crashed in 1987, the dot com bubble peaked, and the 2021 stimulus frenzy fizzled out.
Those are 3 very different markets, and so yes it is different this time.
But the risk of downside echoes on.
From a pragmatic standpoint though, in the end, aside from freak crashes or crises, the thing that causes markets to go down in a sustained fashion (aka bear markets) is economic recession causing earnings declines and stressing weak spots (ultimately earnings are the key driver of stock prices in the bigger scheme of things).
In other words, markets downturns also start with good reason (a catalyst).
For now there are no signs of recession, there’s even some bright spots. But I’m keeping close tabs on the earnings pulse, macro leading indicators, and higher frequency cycle trackers, so I will be sure to update as/when/if the facts change…
Bottom line: valuation indicators are sounding a background warning tone.
p.s. yes —I will update this chart in future editions of The Weekly ChartStorm, so stay tuned!
TRY BEFORE YOU BUY: activate a 3-month free trial to the Weekly ChartStorm now so you can access the latest report, join the Q&A discussions, and get a flow of insights and ideas like those discussed above.
Conceptual Notes — Market Cycle
On of the core philosophies underpinning my research process is that macro and markets go in cycles, and that these cycles more or less rhyme across time, assets/markets, and geographies.
The conceptual model of the market cycle is displayed below — and this version is probably a bit more nuanced than what you might be used to seeing, because it recognizes the psychological turmoil, corporate/governance/peer pressures, and pitfalls that each stage of the cycle brings.
Within this framework we are close to that red dot on the valuation front.
But as they say, the trend is your friend until it bends…

Need help navigating these cycles?
Head over to Topdown Charts Professional for actionable insights, asset allocation research, and portfolio strategies to practically help navigate these cycles.
Topdown Charts provides global multi-asset investors with investment ideas, risk management alerts, and meaningful macro insights to help investors make better decisions, with confidence — so they can achieve their goals and get ahead.
One more thing…
I’ll let the slide below do most of the talking, but basically, as alluded — there is nuance when taking theory into practice. And I would add, valuations are an important piece of the puzzle, but not the only piece (my approach = use many different puzzle pieces to find the true picture).
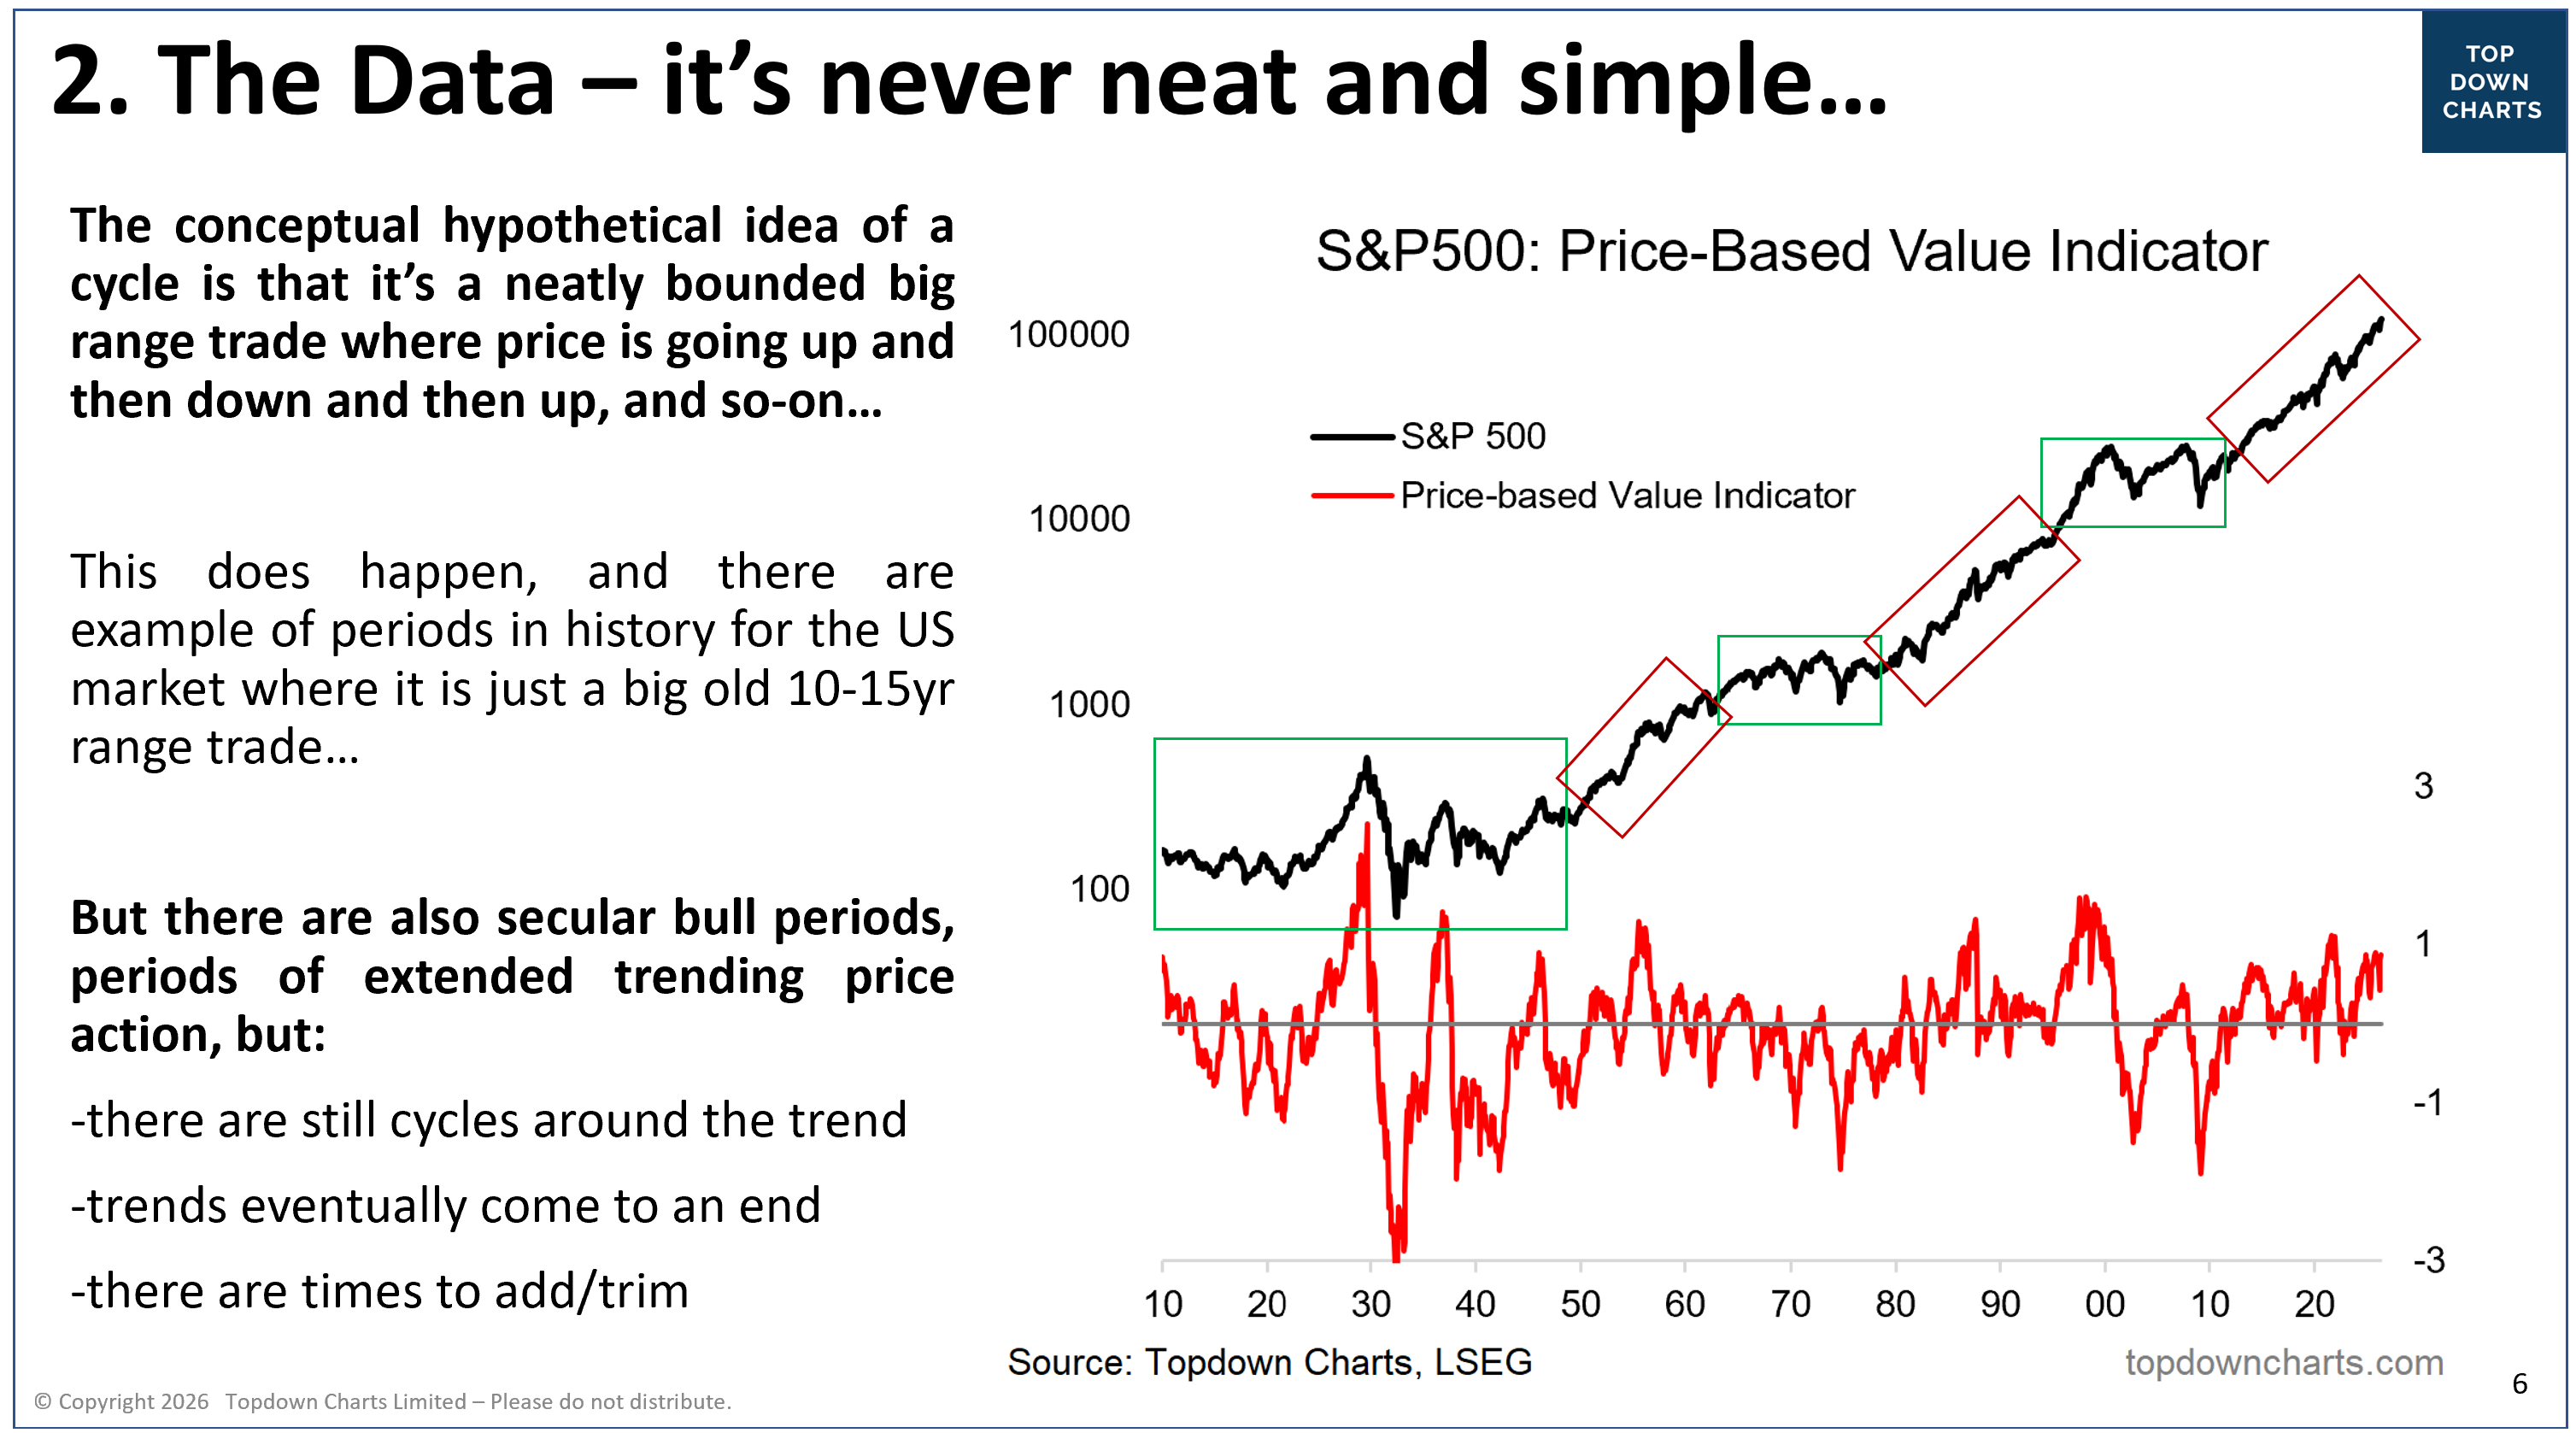
Also as a side note observation on the chart above, for those with a long-term perspective, even the most expensive markets always ended up higher in the longer arc of history (albeit those investors buying/adding on the lows vs peaks would have had a better time!)
Thanks for reading!
For more info on the Weekly ChartStorm see:
If you’re new to The Weekly ChartStorm, or you’ve been thinking about a subscription but want to see more first, here’s something for you to try — a 3-month Free Trial.
Note: that link will prompt you to go through the usual subscription process, but you will not be charged until the end of your 90-day trial period — and you will not be charged at all if you cancel prior to the trial end (and yes, you will receive reminders closer to the time).
Lastly, be sure to reach out at any time if I can help with anything. I promise to leave no questions unanswered and no problems unsolved.
—
Best wishes,
Callum Thomas
Founder & Editor of The Weekly ChartStorm
and Head of Research at Topdown Charts
Twitter/X: https://twitter.com/Callum_Thomas
LinkedIn: https://www.linkedin.com/in/callum-thomas-4990063/
Already a paid subscriber?
Log-in and read the latest report here:

.
Thanks Callum. A few potential catalysts I can think of, though all are connected...
- Longer-than-expected war (even if no significant further escalation)
- Higher oil prices
- Higher bond yields