
Chart of the Week - The Speculation Generation
A Generational Shift in Investing has occurred...

Note: this is a new series for free subscribers and is intended to give an insight into the work that goes into The Weekly ChartStorm + provide a little further explanation on charts and concepts.
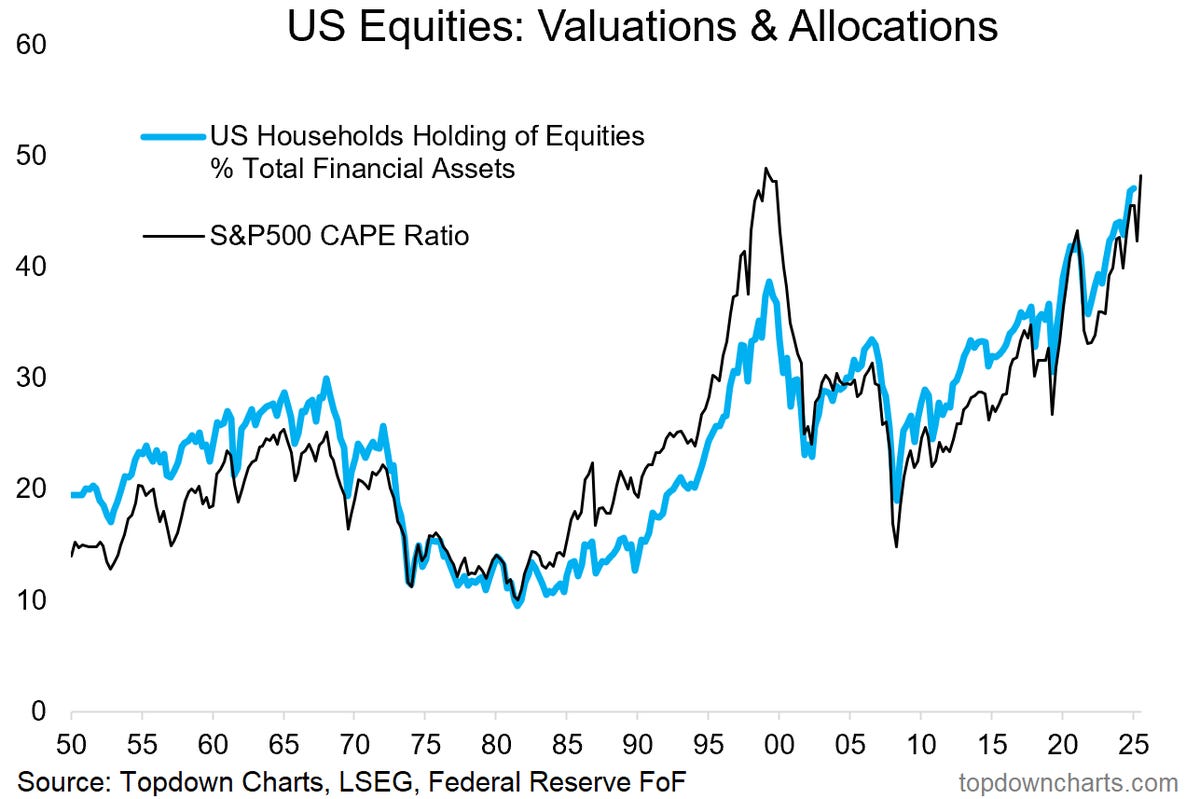
Today’s chart is one for tomorrow’s history books.
It shows US households running the highest allocation to equities on record (and [as a result] the stockmarket trading at record high valuations).
This is the type of shift you see only once in a generation, and it means a fundamental change in market structure with significant implications for the economy, politics, and the forward looking risk vs return outlook.
But to be fair, with the S&P500 gaining more than 10x off the March 2009 lows — it’s an entirely understandable development!
And even though it got this way for very logical reasons (strong earnings growth, waves of tech disruption, low interest rates, passive flows), it’s important to acknowledge that this is not normal and we live in highly unusual times.
Investor confidence is near record highs, earnings optimism is at euphoric levels, defensives and diversifiers are in the dustbin, and social media chatter is saturated with an almost desperate sense of greed (with investors growing accustomed to 2x, 3x, 10x returns, and the bull market minting many geniuses).
This is the speculation generation.
p.s. this is neither good nor bad, it’s just a thing… and that’s the thing: as market analysts we ought to not got get bogged down in good or bad, bullish or bearish, optimism or pessimism —but rather what is the lay of the land? what does the data tell us? and what are the most pragmatic next steps we should take (or prepare to make…)
Bottom line: a generational shift in investor behavior has been observed.
Thanks for reading!
For more info on the Weekly ChartStorm see:
If you’re new to The Weekly ChartStorm, or you’ve been thinking about a subscription but want to see more first, here’s something for you to try — a 3-month Free Trial.
Note: that link will prompt you to go through the usual subscription process, but you will not be charged until the end of your 90-day trial period — and you will not be charged at all if you cancel prior to the trial end (and yes, you will receive reminders closer to the time).
Lastly, be sure to reach out at any time if I can help with anything. I promise to leave no questions unanswered and no problems unsolved.
—
Best wishes,
Callum Thomas
Founder & Editor of The Weekly ChartStorm
and Head of Research at Topdown Charts
Twitter/X: https://twitter.com/Callum_Thomas
LinkedIn: https://www.linkedin.com/in/callum-thomas-4990063/
Already a paid subscriber to The Weekly ChartStorm?
Log-in and read the latest report here:

.
20T the s&p500's 69T market cap trade at greater than 10 times sales, some excessively more. You know the Scott McNealy quote right?