
Chart of the Week - Tech Capex Crowd-Out
Chart in-focus from the latest Weekly S&P500 ChartStorm

Note: this is a new series for free subscribers and is intended to give an insight into the work that goes into The Weekly ChartStorm + provide a little further explanation on charts and concepts.
Capital Expenditure (aka capex) by tech and tech related companies now accounts for half of all S&P500 corporate capex.
Depending on your perspective, this is either the most bullish or bearish chart you’ve seen today!
The bulls will say this is a virtuous cycle of tech acceleration where more investment enables more breakthroughs, rapid rollout and scaling, which leads more revenues and favorable funding, which enables further investment (and so-on)
The bears will say this decadal-doubling is unsustainable and a classic bubble sign + late-cycle signal (there appear to be trends and cycles in this chart).
Meanwhile, economists might quip that it amounts to crowding out of investment that might have gone into industry, healthcare, and natural resources — which will come back to bite us later as flows funnel into AI and neglect real economy capacity building.
The pragmatic view is probably a bit of all of the above.
I would suggest this does look a bit overheated (and does represent a vulnerability), but also reflects the strong cyclical/thematic updrafts helping tech stocks drift higher for longer for now. It also helps explain why commodity prices are headed higher as commodity capex remains sluggish.
So it’s an important piece of the puzzle, and part of a very interesting theme I discussed in the latest Weekly S&P500 ChartStorm…
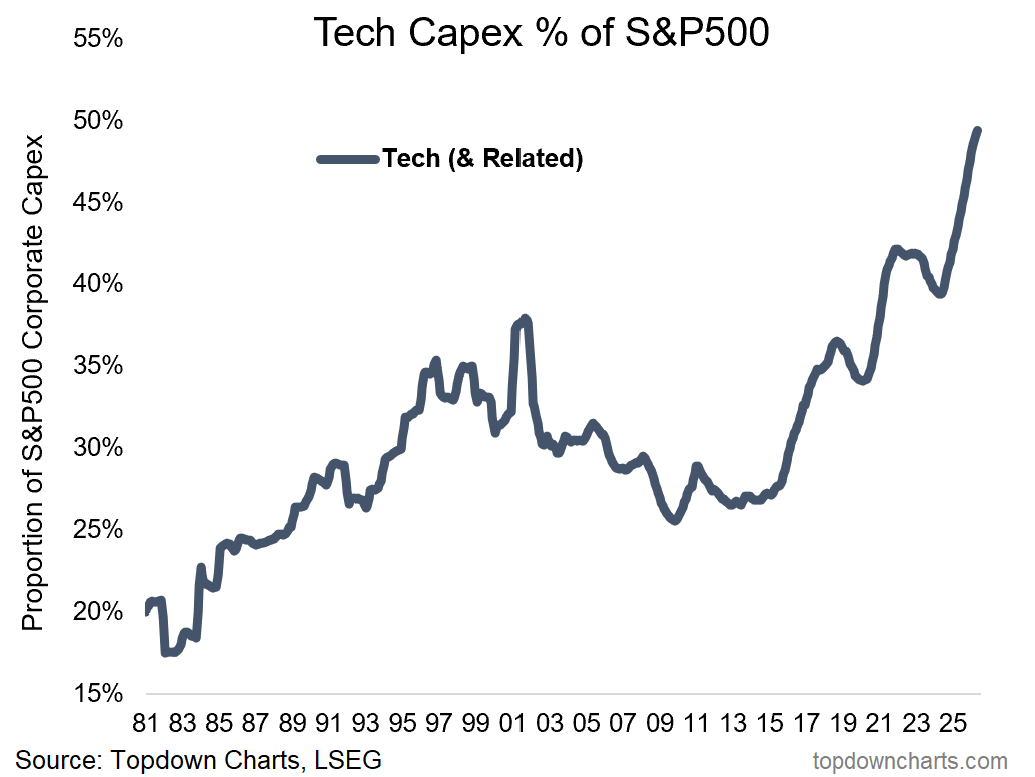
Bottom line: Tech capex has surged to 50% of all S&P 500 corporate capex.
TRY BEFORE YOU BUY: activate a 3-month free trial to the Weekly ChartStorm now so you can access the latest report, join the Q&A discussions, and get a flow of insights and ideas like those discussed above.
Thanks for reading!
For more info on the Weekly ChartStorm service see:
Report Samples (what you get as a subscriber)
Subscriber Reviews (what paid subs think about it)
Benefits of Subscribing (why you should buy)
If you’re new to The Weekly ChartStorm, or you’ve been thinking about a subscription but want to see more first, here’s something for you to try — a 3-month Free Trial.
Note: that link will prompt you to go through the usual subscription process, but you will not be charged until the end of your 90-day trial period — and you will not be charged at all if you cancel prior to the trial end (and yes, you will receive reminders closer to the time).
Lastly, be sure to reach out at any time if I can help with anything. I promise to leave no questions unanswered and no problems unsolved.
—
Best wishes,
Callum Thomas
Founder & Editor of The Weekly ChartStorm
and Head of Research at Topdown Charts
Twitter/X: https://twitter.com/Callum_Thomas
LinkedIn: https://www.linkedin.com/in/callum-thomas-4990063/
Already a paid subscriber?
Log-in and read the latest report here:

.