

Note: this is a new series for free subscribers and is intended to give an insight into the work that goes into The Weekly ChartStorm + provide a little further explanation on charts and concepts.
For most investors the KOSPI is not the first index they check when they get to the desk — they probably don’t even think about Korea…
But you should.
In today’s note I wanted to highlight a topic from my latest Weekly Macro Themes report from Topdown Charts Professional. Basically, Korean equities have gone parabolic.
(and yes, it’s AI again!)
And if you thought the US market was getting top-heavy and concentrated you haven’t seen Korea.
The top stock, SK Hynix, is tracking near-30% of the MSCI South Korea index. Close in second is Samsung Electronics at about 25% of the index. Add in SK Square and a few other stocks related to those two and the AI/chips theme, and you have over half the index tied up with the AI boom (/bubble?).
So what?
Aside from the wild upswing in stocks seen in the chart below, speculators have also bid-up Korean apartment prices, and the geopolitics-driven commodity spike is pushing up PPI inflation, and hence the Bank of Korea is set to get into rate hikes as inflation pressures rise.
The tail risk here is that the new BOK governor (his first meeting is tomorrow) decides to cast aside tradition and just get on with rate hikes (rather than first projecting next steps) when they meet on the 28th of May [Korea Time].
Polymarket has the odds of a rate hike at about 1% — so this is not something people are expecting, and in fairness is a very low likelihood.
But a hawkish surprise could rattle Korean stocks, and being that it’s basically a microcosm of the larger AI trade, it could easily ripple across to US tech stocks.
So it’s a bit of an under-the-radar risk and something to keep an eye on.
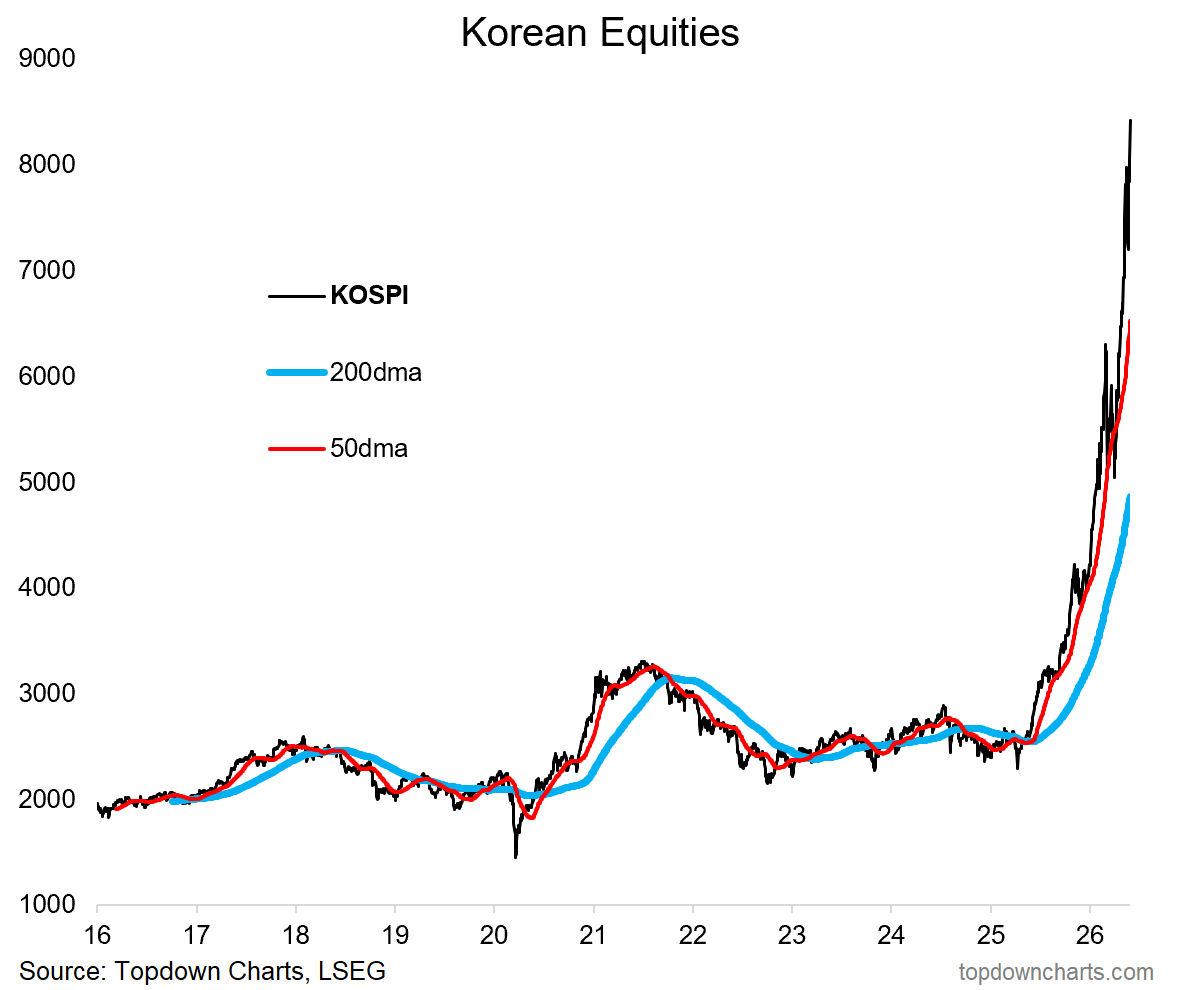
Bottom line: Korean stocks have gone vertical thanks to massive index concentration and the AI boom boosting Korean chip manufacturers (+a natural proclivity for speculation in South Korea).
Want more analysis like this?
The above topic was covered in greater detail in my latest weekly report over at Topdown Charts Professional — and p.s. in case you missed it we are currently running a Founding Members Launch special.
Find out why Topdown Charts is used by some of the world’s largest investors to help them spot opportunities, avoid risks, and stay informed on key macro trends [Click through for More Info].
ALSO: n.b. Topdown Charts clients get The Weekly ChartStorm for free (normally US$195/yr), so this is a great opportunity to power-up your macro/market intel sources to help Gain Clarity on the Outlook and make better investment decisions with confidence and conviction.
Thanks for reading!
Be sure to reach out at any time if I can help with anything. I promise to leave no questions unanswered and no problems unsolved.
—
Best wishes,
Callum Thomas
Founder & Editor of The Weekly ChartStorm
and Head of Research at Topdown Charts
Twitter/X: https://twitter.com/Callum_Thomas
LinkedIn: https://www.linkedin.com/in/callum-thomas-4990063/
Already a paid subscriber?
Log-in and read the latest report here:

.