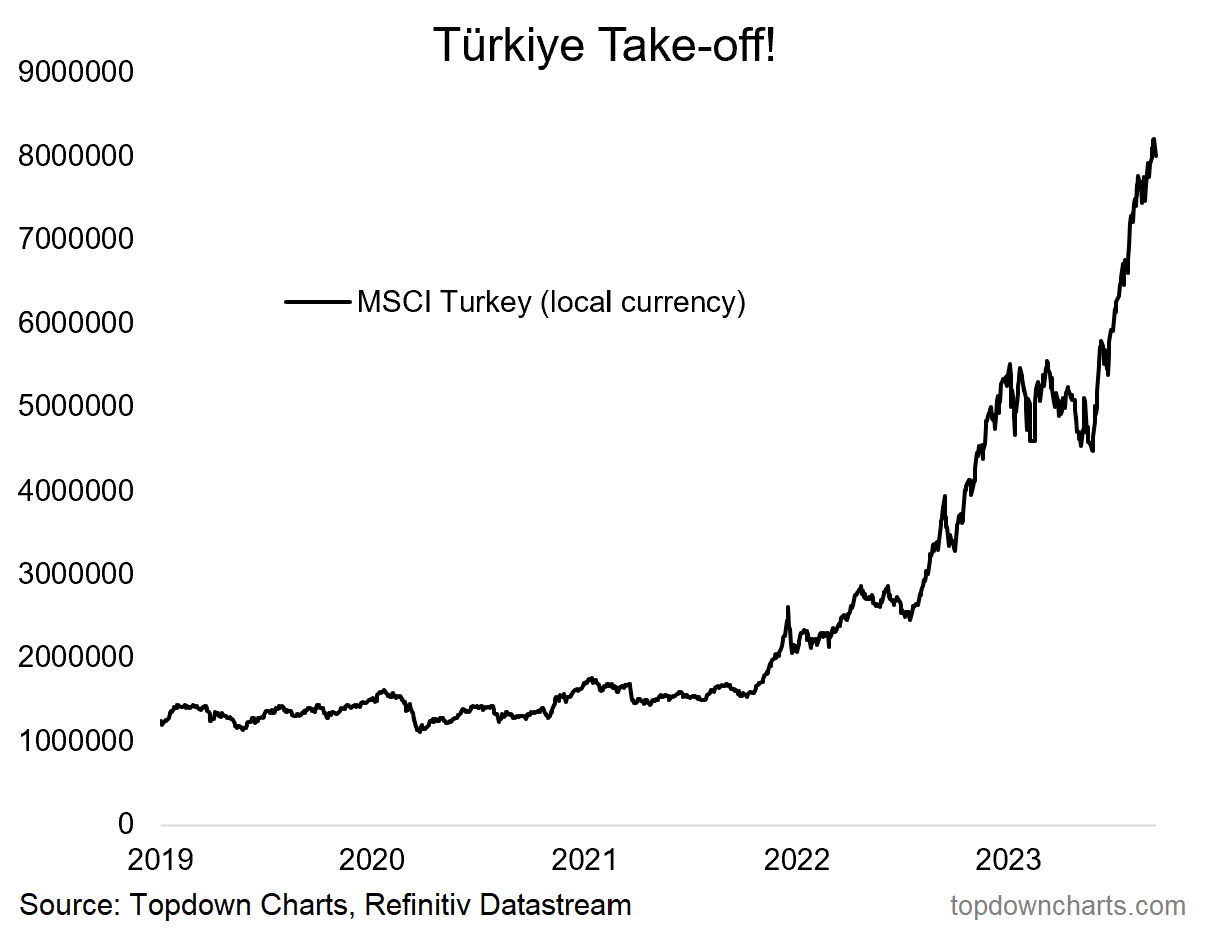
Hyper: Turkish equities are up +640% off the March 2020 lows… in nominal local currency terms. Seems impressive, and in many ways it is, but there are some nuances.
The chart shows the MSCI Turkey index in local currency terms. That should be the first clue — the TRY (Turkish lira) has dropped -77% vs the US dollar over the same period. So in USD terms over the same period the price return is a much lower, but still respectable +80%.
Another aspect is inflation, across that same period, Turkey’s CPI has gone up about +275% — as such inflation adjusted or real price local currency denominated returns therefore drop to ~95%.
So in some respects it’s a bit of a lesson in terms of inflation and/or FX adjusting returns to get a sense for the true/effective picture for both domestic and global investors respectively. But it’s also a lesson in terms of what hyperinflating nominal growth can do to stock prices in nominal terms.
SUBSCRIBE —> Important Note: if you would like to subscribe to receive the Chart of the Day series straight to your inbox;
1. first subscribe to the Weekly ChartStorm as either a paid or free user;
2. navigate to Account Settings, and turn on emails for the Chart of the Day section.
(alternatively you can bookmark the Chart of the Day section page and check-in daily for an interesting variety of timely + timeless updates on the market)
Thanks for your interest. Feedback and thoughts welcome.
Also, please share this free publication with your friends/colleagues :-)
Sincerely,
Callum Thomas
Founder and Editor at The Weekly ChartStorm
Follow me on Twitter
Connect on LinkedIn
NOTE >>> The Chart Of The Day series is brought to you by
The Weekly ChartStorm…
Subscribe to the Weekly ChartStorm for a carefully selected set of charts and expert commentary to help you stay on top of the evolving market outlook —> see why over 31,000 people choose the ChartStorm as their filter on a noisy world ↓


