Chart Of The Day - S&P500 Monthly Chart
The July results are in, S&P500 up +3.11% on the month...
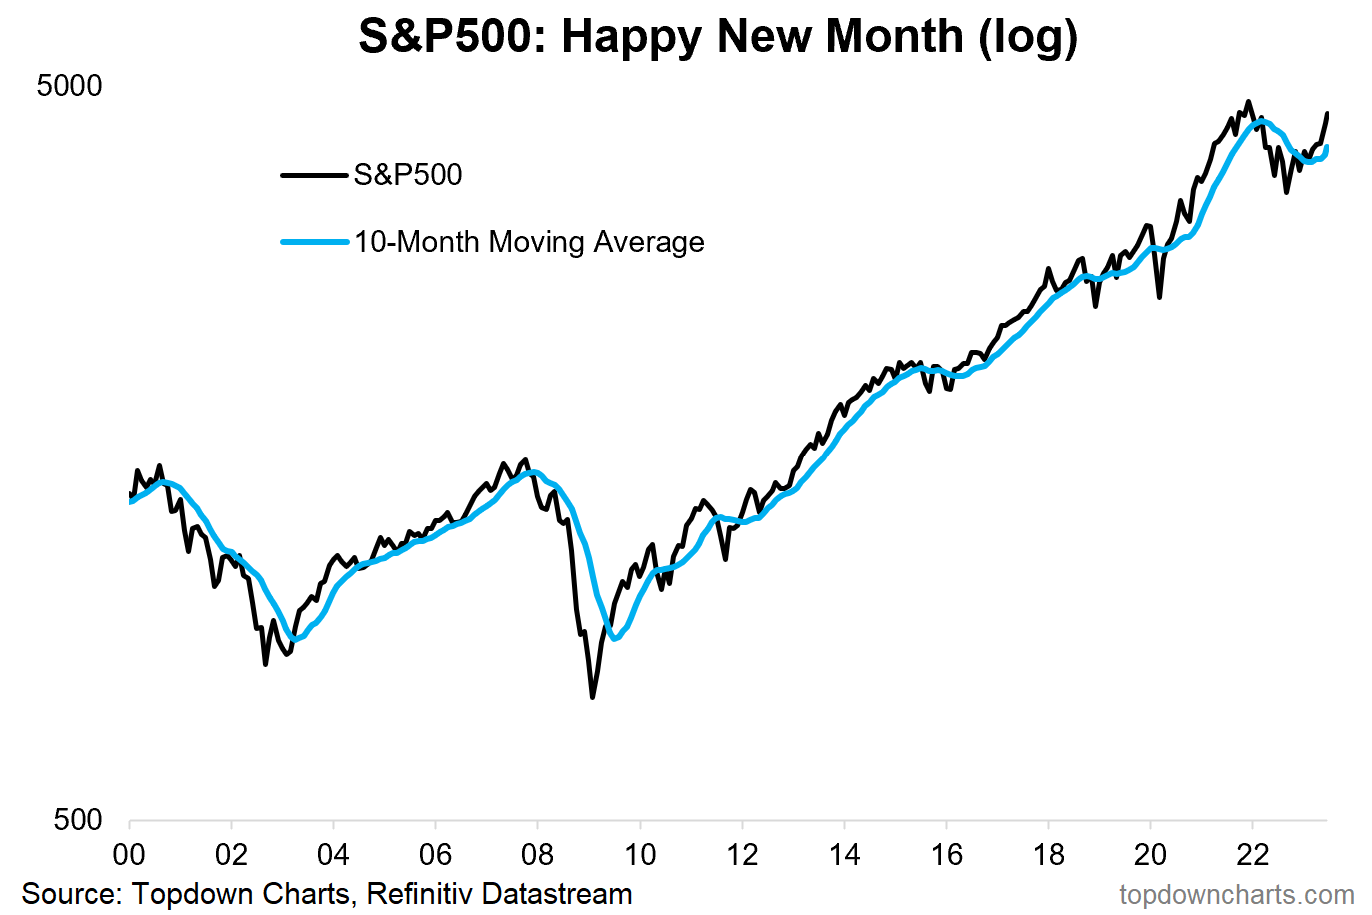
S&P500 Monthly Chart: Another month, another move onwards and upwards. The S&P500 chalked up its 5th consecutive monthly gain at 3.11% in July 2023. Here’s some quick stats following the close:
As of the close on 31 July 2023, the S&P500 is up 19.5% YTD (20.7% in total return terms i.e. including dividends). The equal-weighted version however is only up 9.5% YTD (trailing the cap-weighted by a full 10%!). And for reference, the S&P500 is now up just over 28% off the October 2022 low.
As noted, the positive return in July is the 5th in a row, and the index remains above its 10-month moving average (which it has consistently been so since January), and the 10-month average itself has ticked higher across the last 4 months — overall a very clear uptrend.
As a point of comparison, the 3.11% monthly gain in July for the S&P500 stands in contrast to 3.35% for the equal-weighted, 4.05% for the Nasdaq Composite, 3.35% for the Dow, and 6.06% for the Russell 2000.
SUBSCRIBE —> Important Note: if you would like to subscribe to receive the Chart of the Day series straight to your inbox;
1. first subscribe to the Weekly ChartStorm as either a paid or free user;
2. navigate to Account Settings, and turn on emails for the Chart of the Day section.
(alternatively you can bookmark the Chart of the Day section page and check-in daily for an interesting variety of timely + timeless updates on the market)
Thanks for your interest. Feedback and thoughts welcome.
Sincerely,
Callum Thomas
Founder and Editor at The Weekly ChartStorm
Follow me on Twitter
Connect on LinkedIn
Subscribe to the Weekly ChartStorm for a carefully selected set of charts and expert commentary to help you stay on top of the evolving market outlook


