
Weekly S&P500 ChartStorm - 16 October 2022
This week: various measures of investor sentiment, retail investor exodus, positioning, corporate bond risk indicator, earnings warnings for Q3, fed pivot caution, average age of founders, seasonality

Welcome to the Weekly S&P500 #ChartStorm — a selection of 10 charts which I hand pick from around the web and post on Twitter.
These charts focus on the S&P500 (US equities); and the various forces and factors that influence the outlook - with the aim of bringing insight and perspective.
Hope you enjoy!
1. Rising Risk Appetite? The "Investment Manager Index" ticked higher in October, with what now looks to be a rising trend in risk appetite, and a big jump in expected performance. Changes in valuations (less expensive) were a key driver, and perceived slight alleviation of macro headwinds, but there were renewed concerns on equity fundamentals...

Source: Investment Manager Index - October 2022 Release
2. Retail Investor Movements: On the other hand, the more retail focused TD Ameritrade "Investor Movement Index" ticked further lower in September… that said, they did note in the release that “TD Ameritrade clients were, however, net buyers of equities in September.“ — I guess proving there is still ample appetite to buy the dip (or at least to dollar cost average!).

Source: TD Ameritrade Investor Movement Index
3. The Rise and Fall of Retail Investing: Bespoke's survey of consumers showed a record low % that say they invest in financial markets.
Probably reflects a combination of bad market performance and less money to invest as the bad macro crunches consumers...

Source: @bespokeinvest
4. Stock & Bond Bears: Traders are heavily short financial assets (stocks and bonds). Can't blame them given the dual bear of 22. Or in other words, this is where you should position when both stocks and bonds were trading expensive and then you throw in an inflation shock and global monetary policy tightening frenzy.
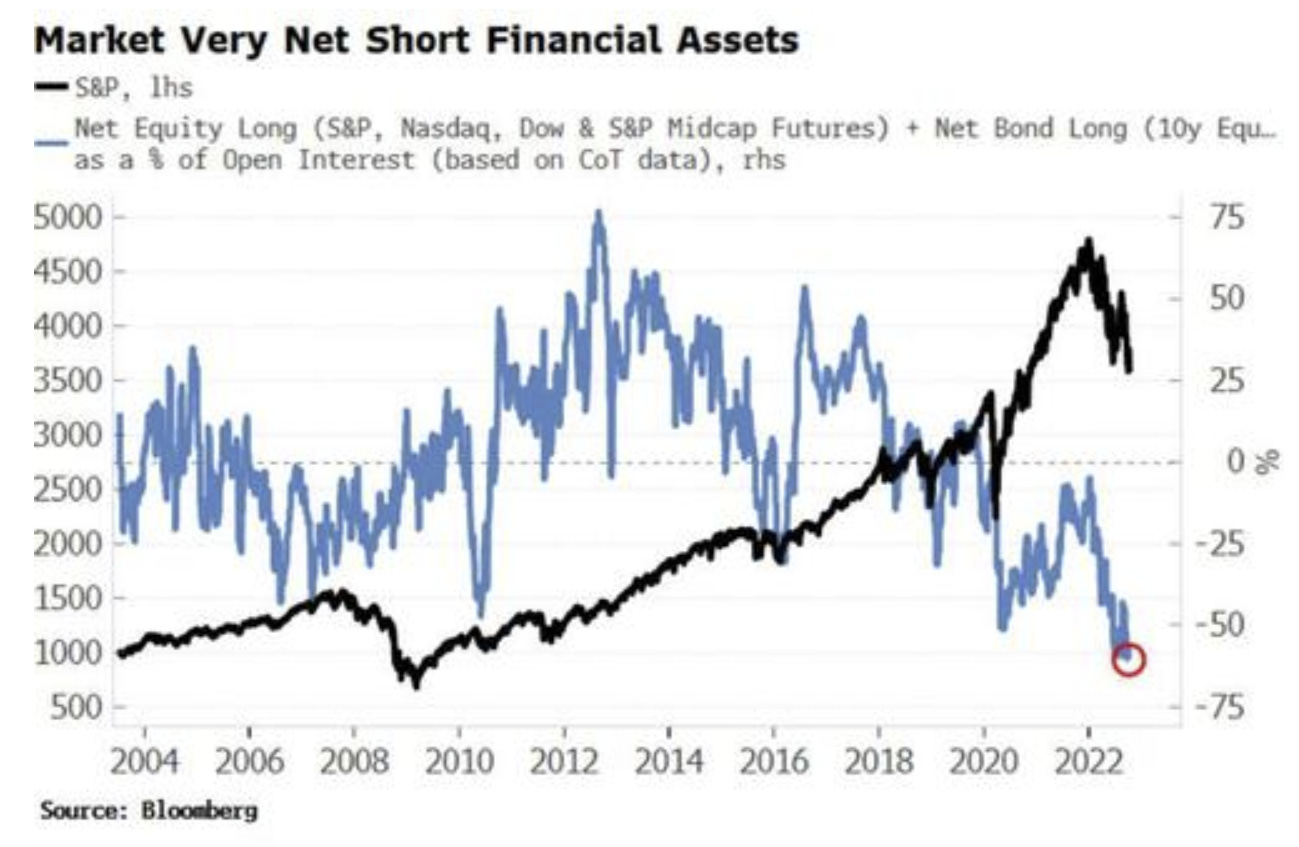
Source: @zerohedge via @dailychartbook [see Daily Chartbook]
5. 60/40 funk: Worst year ever for this version of the 60/40 portfolio (60% equities and 40% long bonds). Though, n.b. it is annualized: so makes it look worse (i.e. it still has 3 months to get better or worse!). As noted last week (in the bonus chart section), there were signs for those who wanted to look for them…
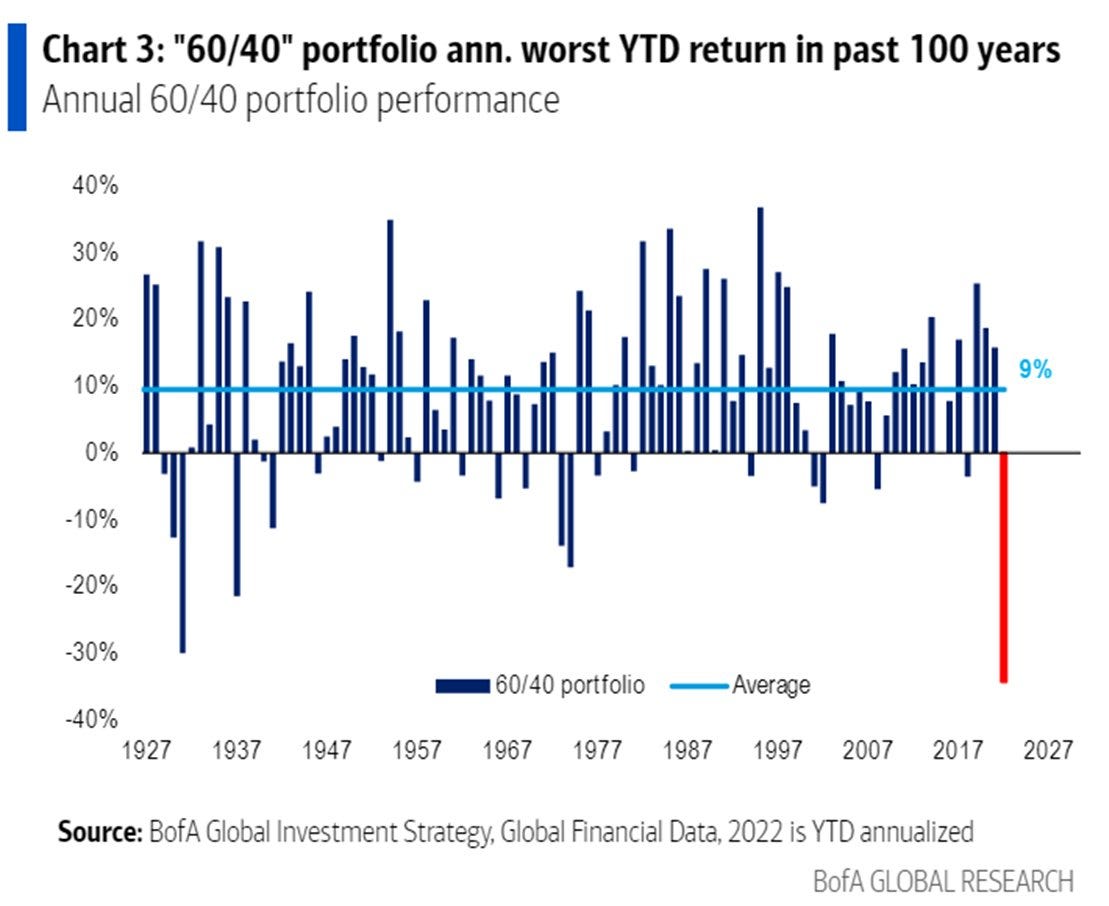
Source: @MstarBenJohnson
6. Lower Lows: This junk bonds trend is not your friend.

Source: @McClellanOsc
7. Pre-Announcements Pre-View of Things to Come: Record number of negative earnings pre-announcements... earnings recession incoming?

Source: @MikeZaccardi
8. Earnings Recession: Big cuts to Q3 earnings estimates -- worse than usual, and a stark departure of the pattern of the past couple years. Hard to out-earn the economy when a clear slowdown is underway (and ample monetary headwinds).
Source: @ISABELNET_SA
9. When Pivot: Many are asking “when pivot?“
Few are asking “what happens if pivot?“ — perhaps a better question is: “when sustainable bottom” (and what holistic framework should we be using to determine what that looks like?). In other words, this is not March 2020, a recessionary bear market takes longer to bottom; among other things, the economy needs to actually bottom for the market to bottom. Just like Fed rate hikes take time to pile-up and inflict economic damage, a pivot to easing will take time to filter through too.

Source: @nickgerli1
10. Old Spice: "the older you are, the more likely you are to succeed as a startup founder" (sweet spot seems to be 50's).
(I would speculate it's a combination of things like experience, connections, financial standing, family stage, mindset/goals, industry knowledge/context, etc)
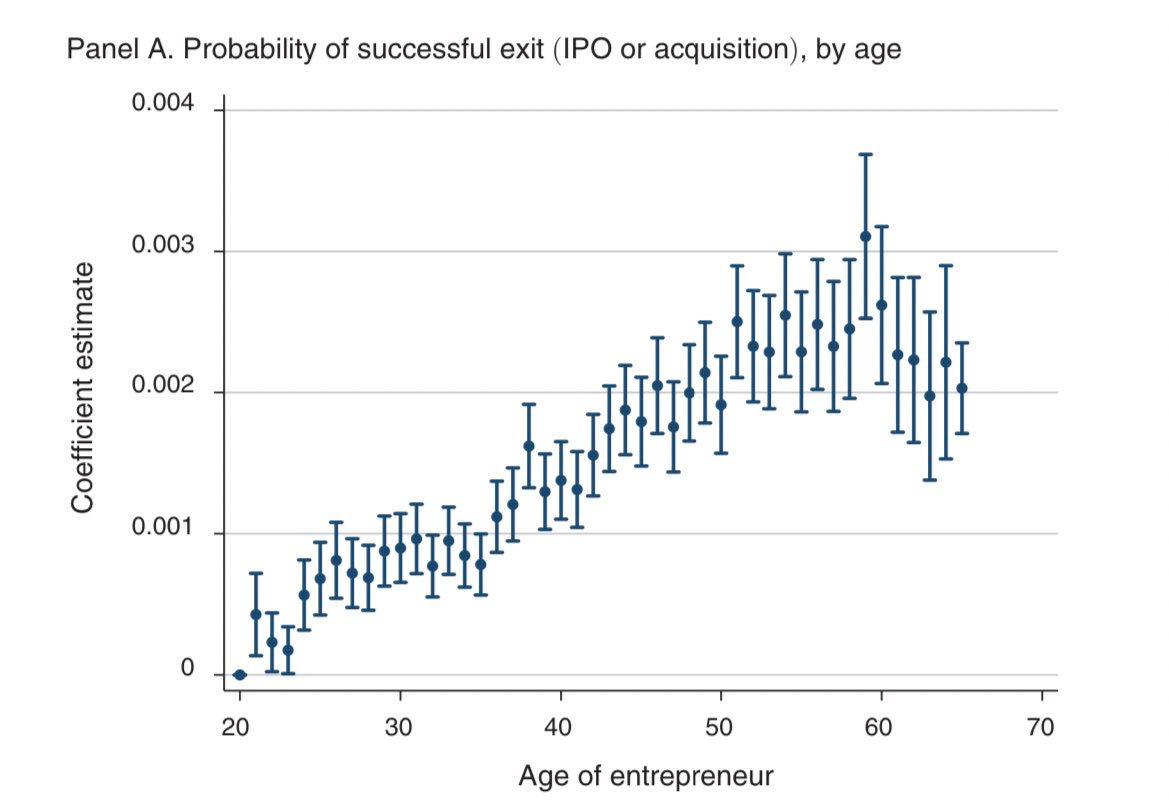
Source: @ASvanevik (link to study: Age and High-Growth Entrepreneurship)
Thanks for following, I appreciate your interest!
BONUS CHART >> got to include a goody for the goodies who subscribed.
Season’s Greetings: (no it’s not an early holidays greeting, although n.b. there are only 10 weeks until Christmas!)
The seasonal script is changing as we head into Q4 — should we care?
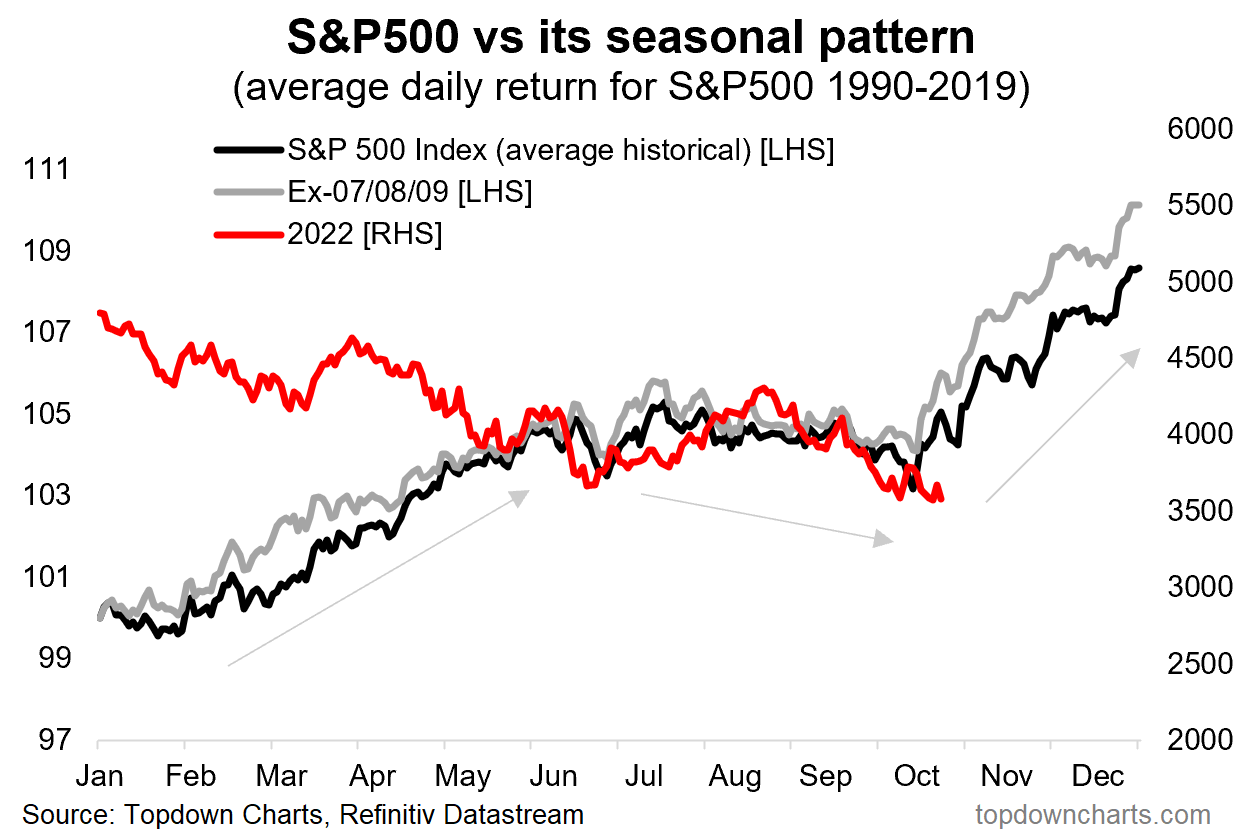
The typical tendency for stocks in Q4 is to rally. But as I have previously pointed out, there are many exceptions to the seasonal rules in markets, and indeed, markets happily ignored the usual seasonality trends in H1.
I’ve previously mused that when it comes to seasonality, you basically use it in one of two ways: as a prompt to consider something you might not have previously considered, or as a final element to a strong existing case to help raise conviction and help with timing.
In that respect, I would *not* classify this as a case of the latter: macro and market momentum remains bearish, valuations have reset but not enough to be cheap, financial conditions are tight and tightening… this is not a bullish setup. So the seasonal info is at odds with the wider evidence, and therefore does not add to that case, and being low-grade information: it is not enough to negate it.
So that leaves us with the former: a prompt to consider something we might not have previously considered… a Q4 rally.
To consider that: sentiment is extremely bearish, so by definition there are a lot of minds that could be changed and in so doing drive upside. The other elements could be something like better economy/earnings than expected, geopolitical upside surprises, and/or more supportive (or less restrictive) fiscal/monetary policy, weaker USD, etc. Much of what I described there is basically speculative and relies on hoping for something good to happen… relies on looking for facts that are not there yet.
So I would say this is an interesting chart that prompts thinking, but is not something to change the view, at least for me, and at least given what we know at the moment.
—
Best regards,
Callum Thomas
Double Awesome! Thanx! Rj
🤝