Weekly S&P500 ChartStorm - 9 July 2023
This week: bullish speculation revival, investor sentiment, analogs, intermarket divergences, monetary risk, dividend growth, private equity flows, EM equities for the long-term, cash allocations...
Welcome to the latest Weekly S&P500 #ChartStorm!
Learnings and conclusions from this week’s charts:
The mood has changed: surveyed sentiment has gone from 2008 crisis levels to now outright bullish, retail flows resurging, and bullish speculation is back.
Investors are reducing allocations to cash (important contrarian signals).
Divergences abound (global equities vs global central bank liquidity, Nasdaq vs treasuries, US vs China tech stocks).
Private equity funds are seeing heavy net-outflows.
EM equities have gone basically sideways for 16-years after peaking in 2007 (at record high valuations), which highlights the point that price-paid matters.
Overall, it’s interesting to reflect on how far and fast sentiment has shifted from deep pessimism to now outright optimism. It raises interesting questions: were things really that bad then? (and) are things really that good now? It also highlights two points to ponder; 1. the crowd is often wrong at extremes, and 2. sentiment-driven moves can go further than you expect.
1. Speculation is So Back: This indicator tracks the popularity of leveraged long US equity ETFs relative to leveraged short (or inverse) ETFs. You can see clearly both the euphoric frenzy that took hold in 2021, as well as the subsequent collapse in bullish speculation… and now, after a year of slumber, bullish speculation is back in style.
Source: @topdowncharts Topdown Charts
2. Retail Flows: Here’s another angle on it, showing retail investor flows into single stocks and ETFs. Broadly speaking it’s a similar pattern, but interestingly, on first glance I would say the most important capitulation stage happened earlier this year (which echoed on from the capitulation phase around the October lows last year). In hindsight, and on this data, you could argue that the regional bank crisis (not to mention debt ceiling + recession scare) was the best thing to happen for stock market bulls this year by providing a final flush to sentiment.
Source: Daily Chartbook
3. Speaking of Sentiment: After last year notching up the worst reading since the 2008 financial crisis, the sentiment surveys (this is a combined view of the AAII + II surveys) have shown a stark turnaround from deep pessimism to now outright optimism. Were things really that bad back then? Have things really improved that much now? It’s a fascinating collective changing of minds, and it does beg the question that if the crowd was in hindsight wrong back then, are they right now?
Source: @topdowncharts Topdown Charts Professional
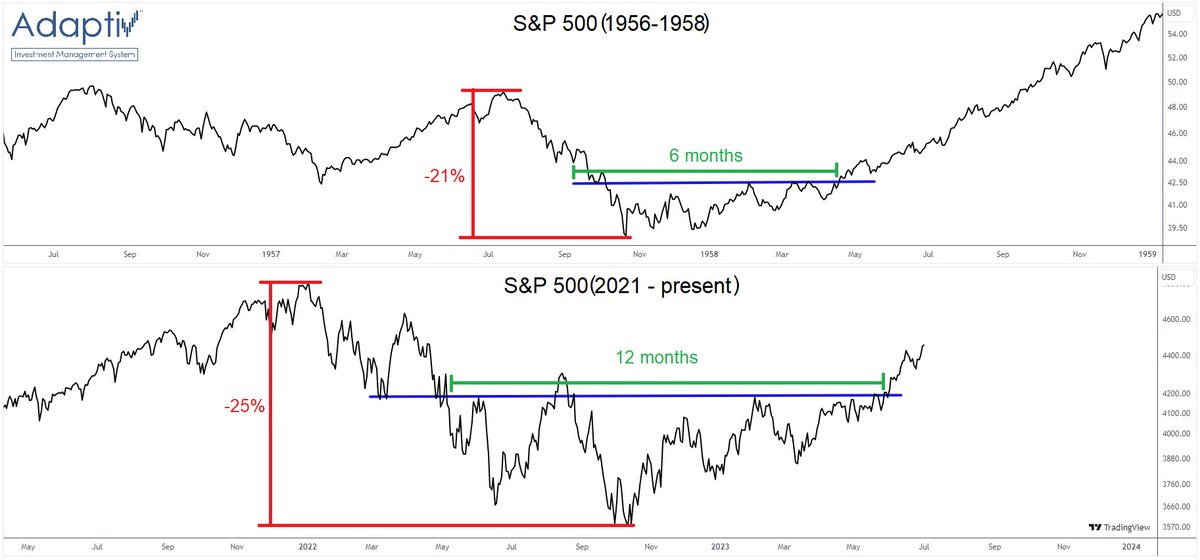
4. On Analogs — the 1958 Situation: This is an interesting perspective, not so much for the macro/value backdrop, but more for the price-psychology developments. Both situations had a similar sized drawdown, followed by a long period of base-building before breakout.
Source: @the_chart_life
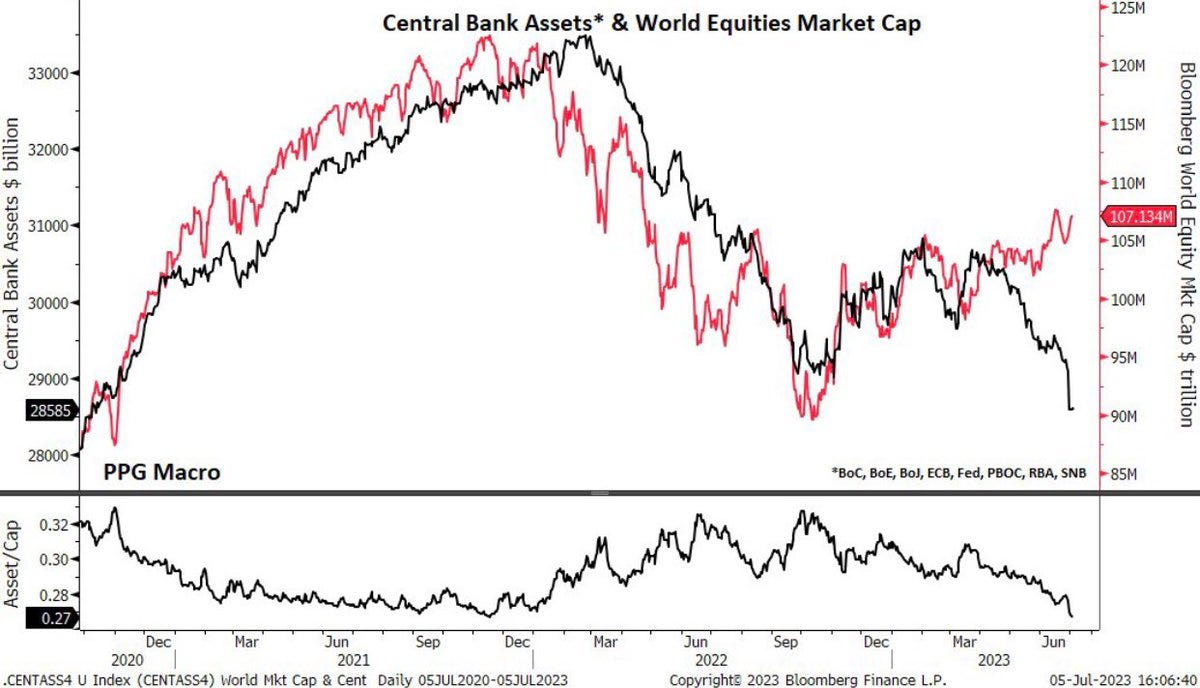
5. Global Central Bank Liquidity: With central banks still furiously tightening across the globe, the question is how much longer can global equity markets defy the monetary gravity.
Source: @PPGMacro via @joosteninvestor
6. Divergence or Decoupling? For the time being, it sure looks like this relationship has broken down, making a case for decoupling (as investor enthusiasm returns, AI hype flourishes, and bullish speculation steamrolls any fundamental quibbles). But yet, it is also a divergence — and if yields push further higher having broken back above the 4% level, it could rattle investors’ newfound optimism.


