
Weekly S&P500 ChartStorm - 8 March 2026
This week: technical check, downside risk monitor, next steps for software stocks (technicals, positioning, valuations) and energy stocks room to run...

Welcome to the latest Weekly S&P500 #ChartStorm!
Learnings and conclusions from this week’s charts:
The S&P500 has broken a key short-term support level.
This is from a starting point of stretched sentiment/valuations.
(Therefore risk of further downside is elevated.)
Software stocks are bouncing from cheap and oversold conditions.
Energy stocks are getting a geopolitical boost with room to run.
Overall, the technical picture is enough to make one pause to think. With the various parallels to 2022 it certainly heightens the risk management senses. And yet there’s still some very interesting sector setups…
1. Here we go Again: with multiple parallels to 2022 (geopolitical event, commodity price spike — set against a backdrop of expensive valuations, stretched sentiment), the latest echo is in the technicals. Take a passing glance at this chart and it does not look good. The index is rolling over, broken through initial support, and breadth is falling but not yet oversold.
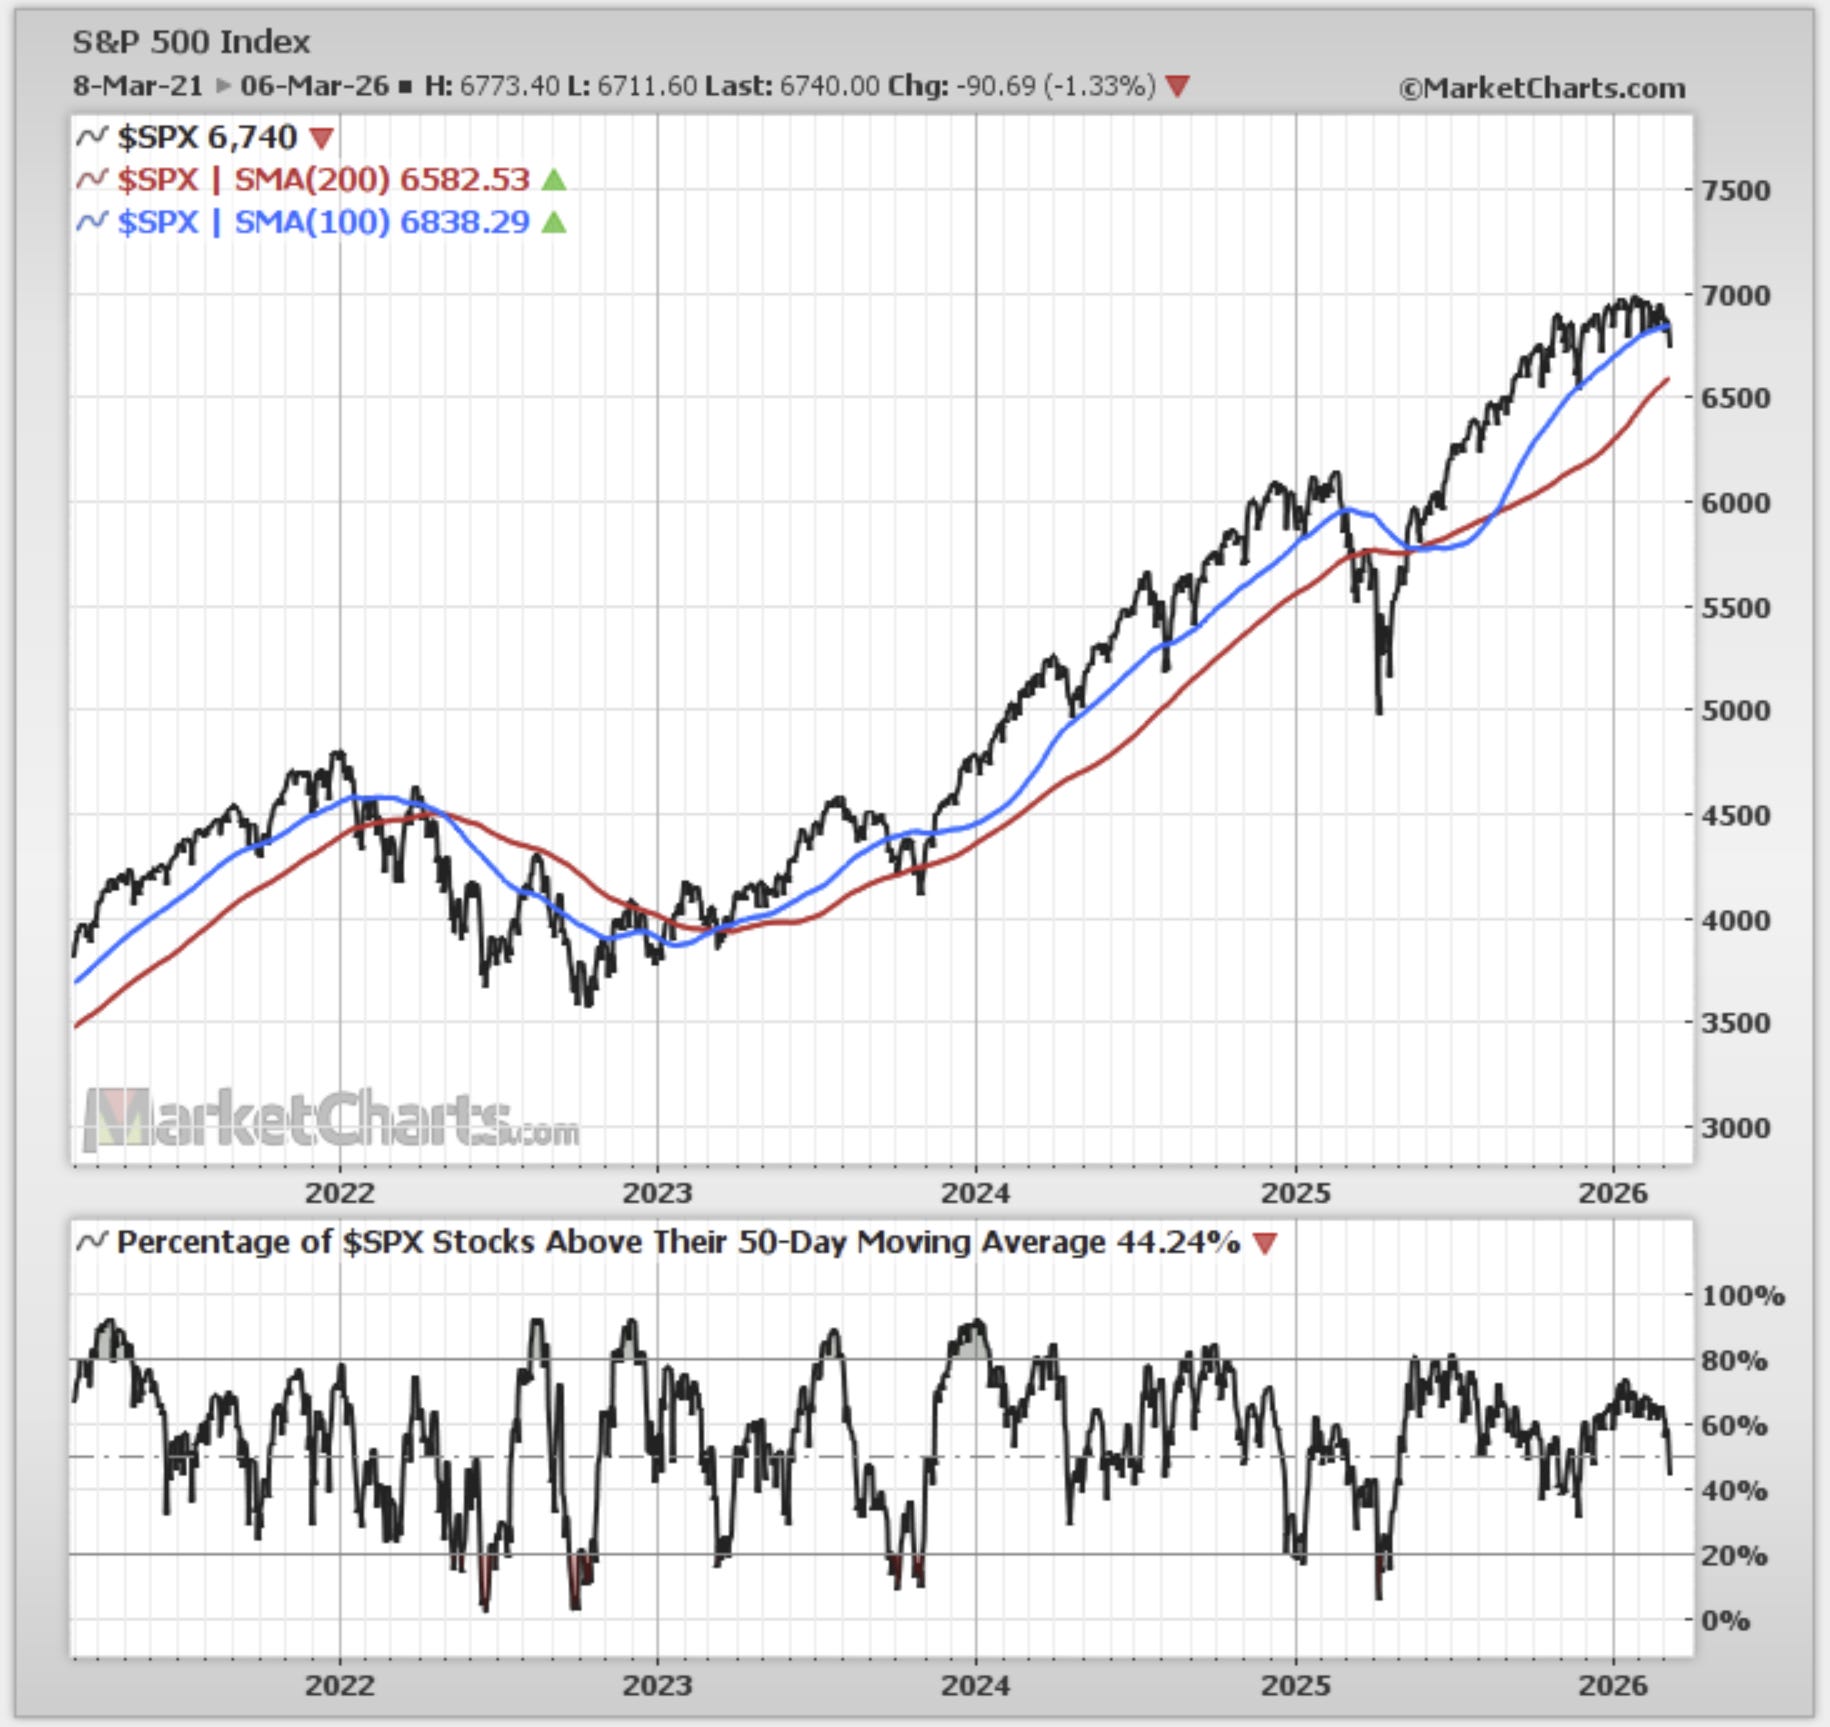
Source: MarketCharts.com
2. And the issue is… sentiment and valuation indicators are rolling over from stretched levels. That’s a key distinction: elevated sentiment and valuations by themselves are not necessarily bad (e.g. if there are offsetting factors) —but what is bad is when they start falling from stretched levels.
Just like on the flipside, a true oversold signal is when the indicator falls to oversold levels and then turns up. A true risk/bearish signal is when indicators like these go to stretched levels and then turn down. Be alert.
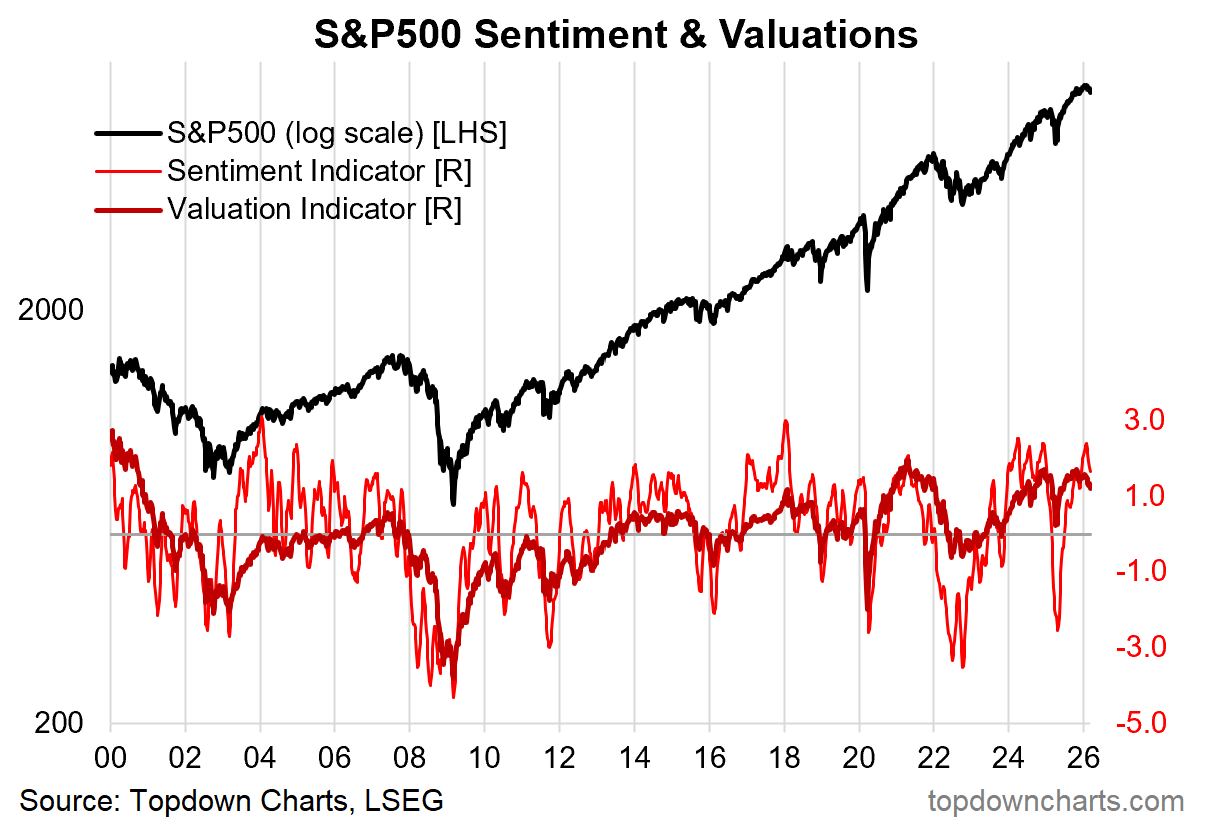
Source: Topdown Charts Professional
