
Weekly S&P500 ChartStorm - 7 September 2025
This week: tech top technicals, asset allocation, market extremes, macro issues, Fed rate cuts and the stockmarket...

Welcome to the latest Weekly S&P500 #ChartStorm!
Learnings and conclusions from this week’s charts:
Tech Stocks and Bitcoin peaked in August.
Tech & Bitcoin both saw extremes in investor positioning.
Tech continues to trade on historically expensive valuations.
Aggregate investor allocations to equities reached a record high.
Weak labor data raises the odds of Fed rate cuts (impact on stocks = ?).
Overall, while tech stocks have been riding the wave of strong fundamentals, the higher they climb: the higher the stakes. And that’s why it’s interesting to note the technical top in tech in August. Aside from that there’s the increasingly murky macro backdrop, featuring softening labor, rising inflation risk, and the teetering prospect of “good cuts vs bad cuts” — I explain, and provide my 2 cents on the next steps…
n.b. for New readers check out “Getting Started” (how to make the most of your subscription to the Weekly ChartStorm + FAQ and reviews).
1. Tech Top: In case you missed it, both Tech Stocks & Bitcoin topped earlier in August (this is technically true, prices reached a high and have not surpassed that level since). Whether this is *the* top is an open question, but facts are both of these lines have stopped going up for now.
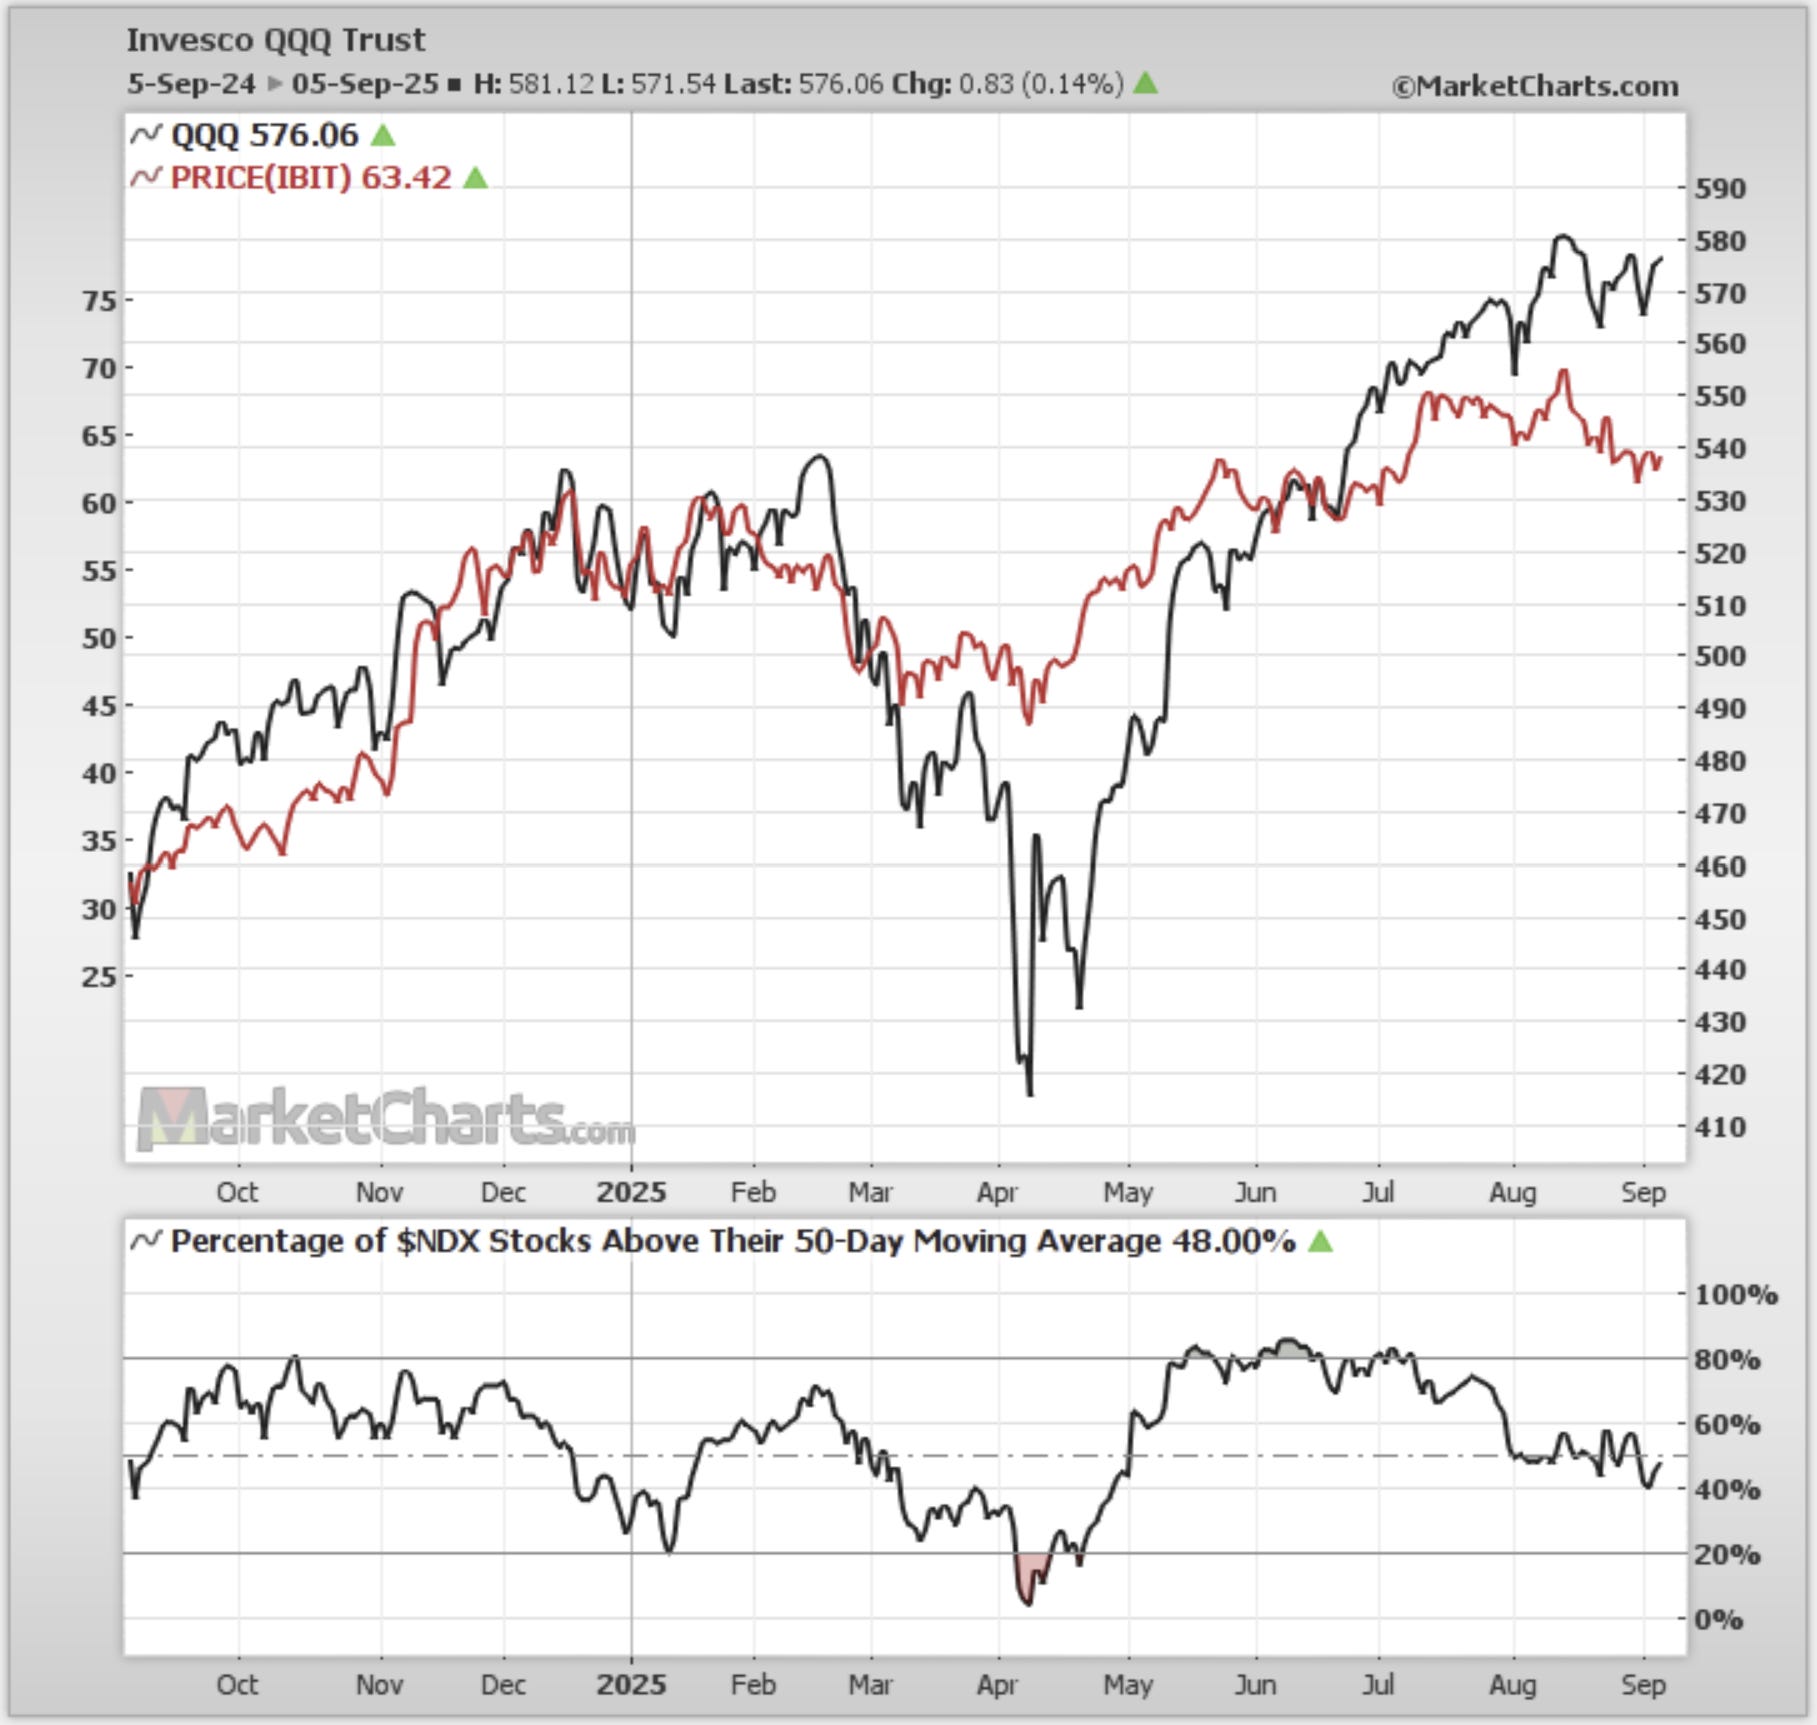
Source: MarketCharts
2. Speculation Echoes: Taking a step back, the reason we look at these two together is because ever since 2020 they’ve been traveling a similar path and riding the same waves of liquidity and speculation. The problems start when either liquidity-speculation-loops spiral to excess (and reverse) and/or when you get cracks appearing in the confidence structure (as there does seem to be recently).
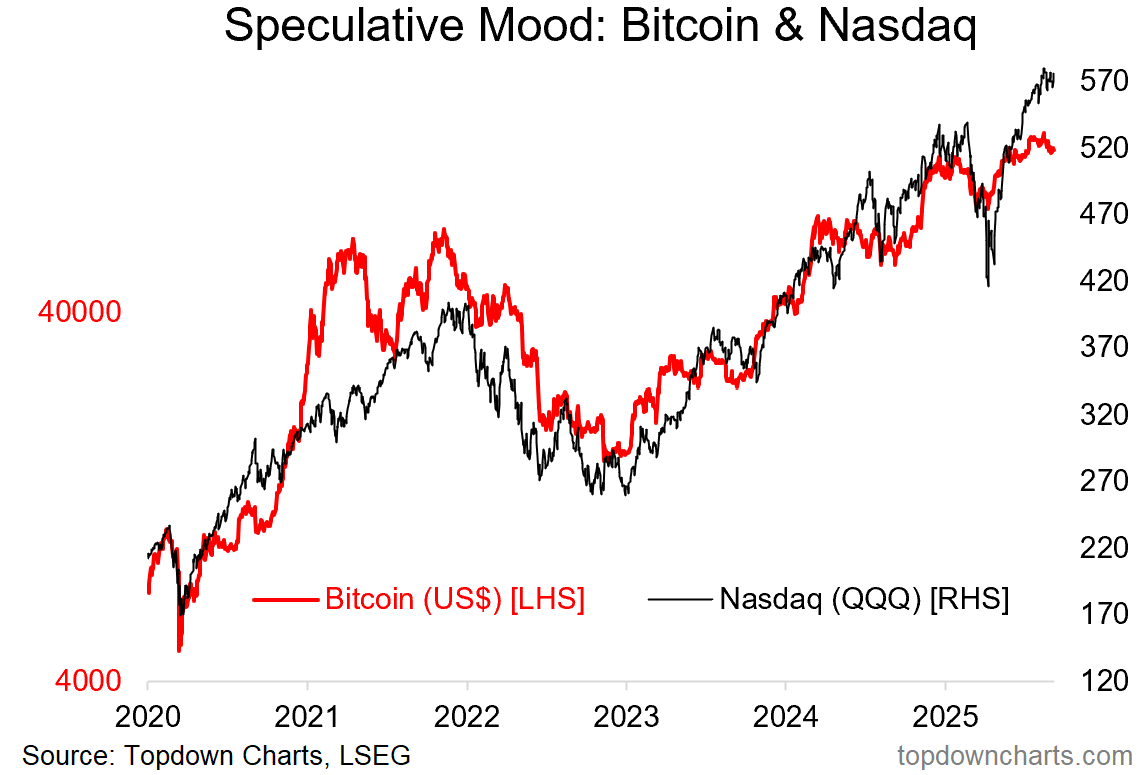
Source: Topdown Charts
3. Investor Allocations to Crypto: And on the bitcoin side of things, there are some red flags waving e.g. investor allocations to bitcoin/crypto ETFs reached a record high and rolled over (and other surveys also show record high allocations by individual investors). This echoes what we see in tech (investors are likewise running record high allocations to tech stocks).
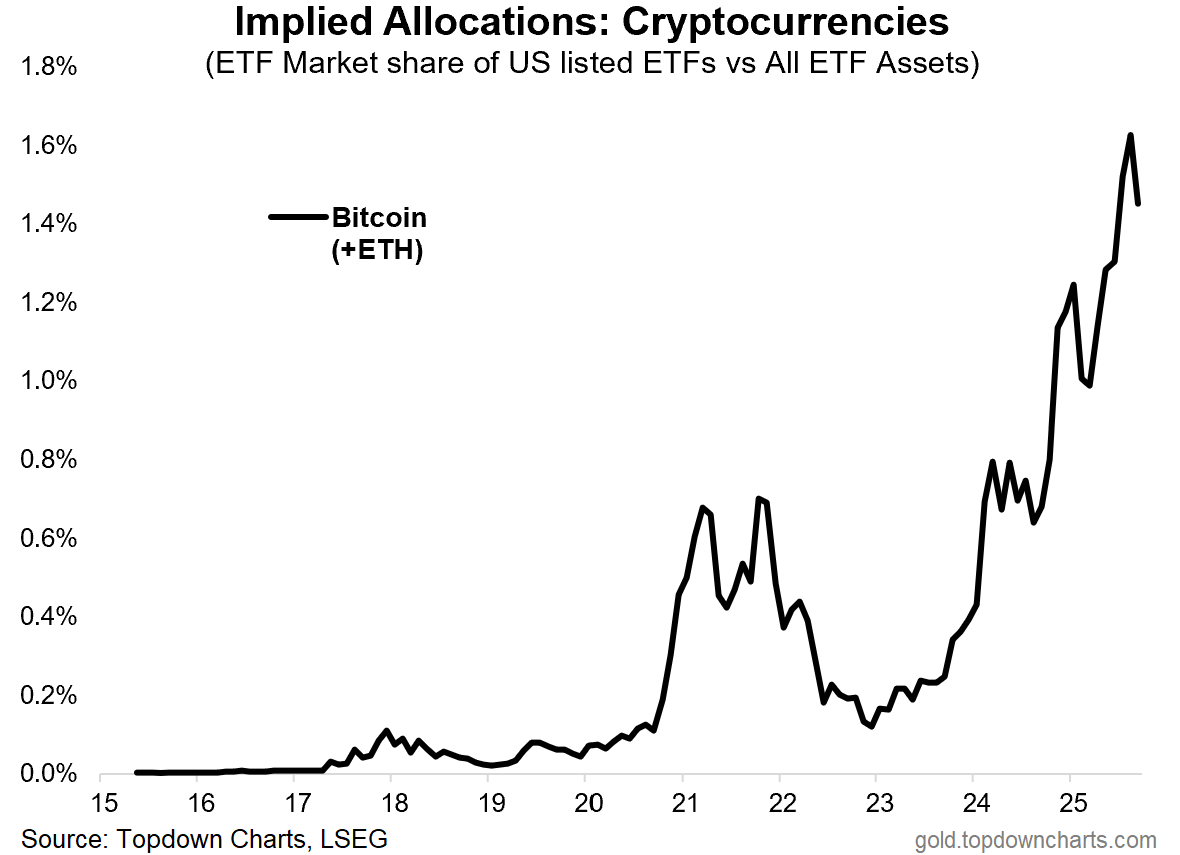
Source: Chart of the Week - Bitcoin Tipping Point
4. AI Epicenter: Closely linked with crypto, the surge in semiconductor market cap weights shares a similar shape and also makes you think (even if it is backed by surging revenues).
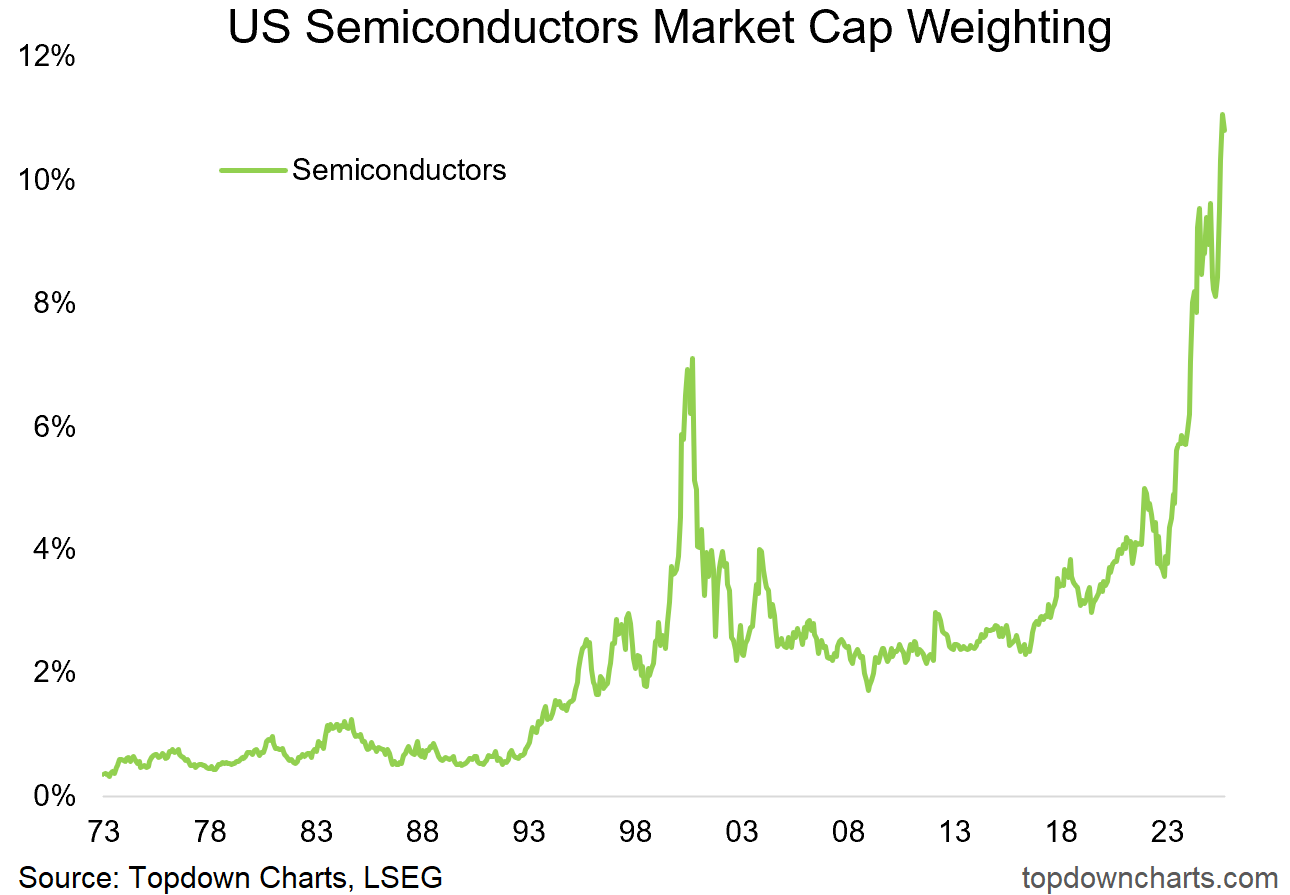
Source: Chart of the Week - Speculation Heights
5. So What if Tech-Tops? And as a reminder, here’s why we care about tech — if the technical top we just saw ends up being “““the top””” here’s what’s at stake. I mentioned the confidence structure before, it’s basically everything that’s supporting ever higher valuations: from sound fundamental reasons like strong earnings, through to self-licking narrative-cones. If you dismantle the confidence structure which is holding up historically high valuations, prices can fall further and faster than you think (“slowly at first and then all of a sudden”).
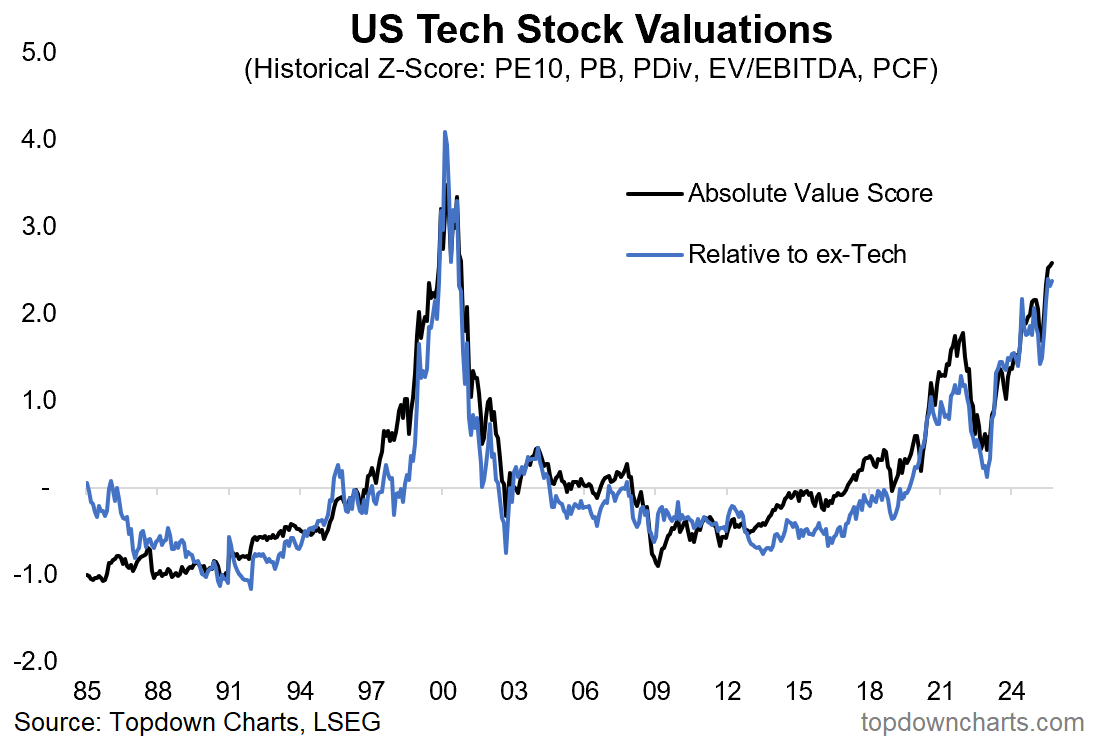
Source: Topdown Charts Professional
6. Follow the Leader: One more on tech before we look elsewhere, this one illustrates two final points; first, just how extreme the run has been in US Tech (vs global tech stocks and vs US non-tech stocks) — both in magnitude and in the relentless multi-year run that it’s been (got to love that exponential-shaped curve). Second, clearly US tech stocks have been the leaders and primary source of strength… so if tech goes, you better hope something else steps up to fill the market leadership vacuum.
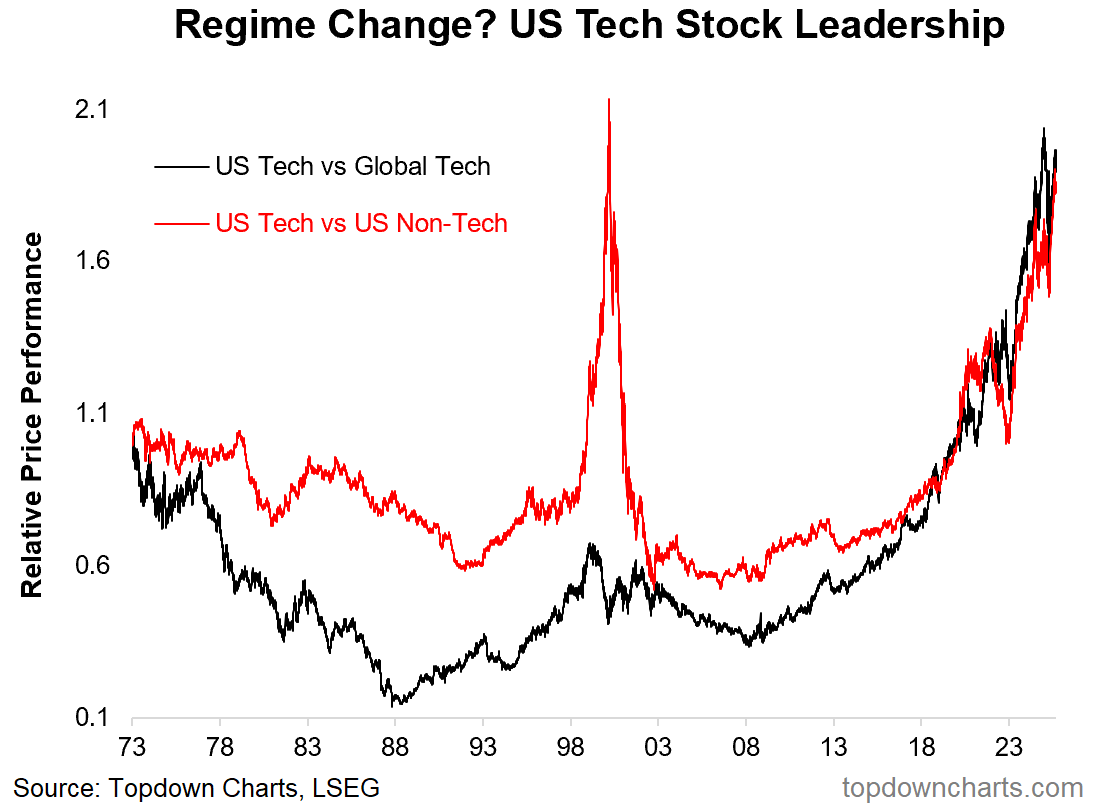
Source: Chart of the Week - US Equity Leadership
7. Aggregate Asset Allocations: Slightly related, but a larger issue is how investors are increasingly all-in on stocks in general (at least relative to history). In hindsight, higher allocations to equities would have been the right call (and probably still will be in the much longer arc of history). But looking forward, if tech does run into trouble it’s going to leave a mark on what appear to be less and less diversified portfolios…
