Weekly S&P500 ChartStorm - 7 May 2023
This week: technical check, bank stocks, credit crunch, demand dampening, earnings macro indicators, PE ratio usefulness, survey-positioning-macro disconnects...
Welcome to the latest Weekly S&P500 #ChartStorm!
Learnings and conclusions from this week’s charts:
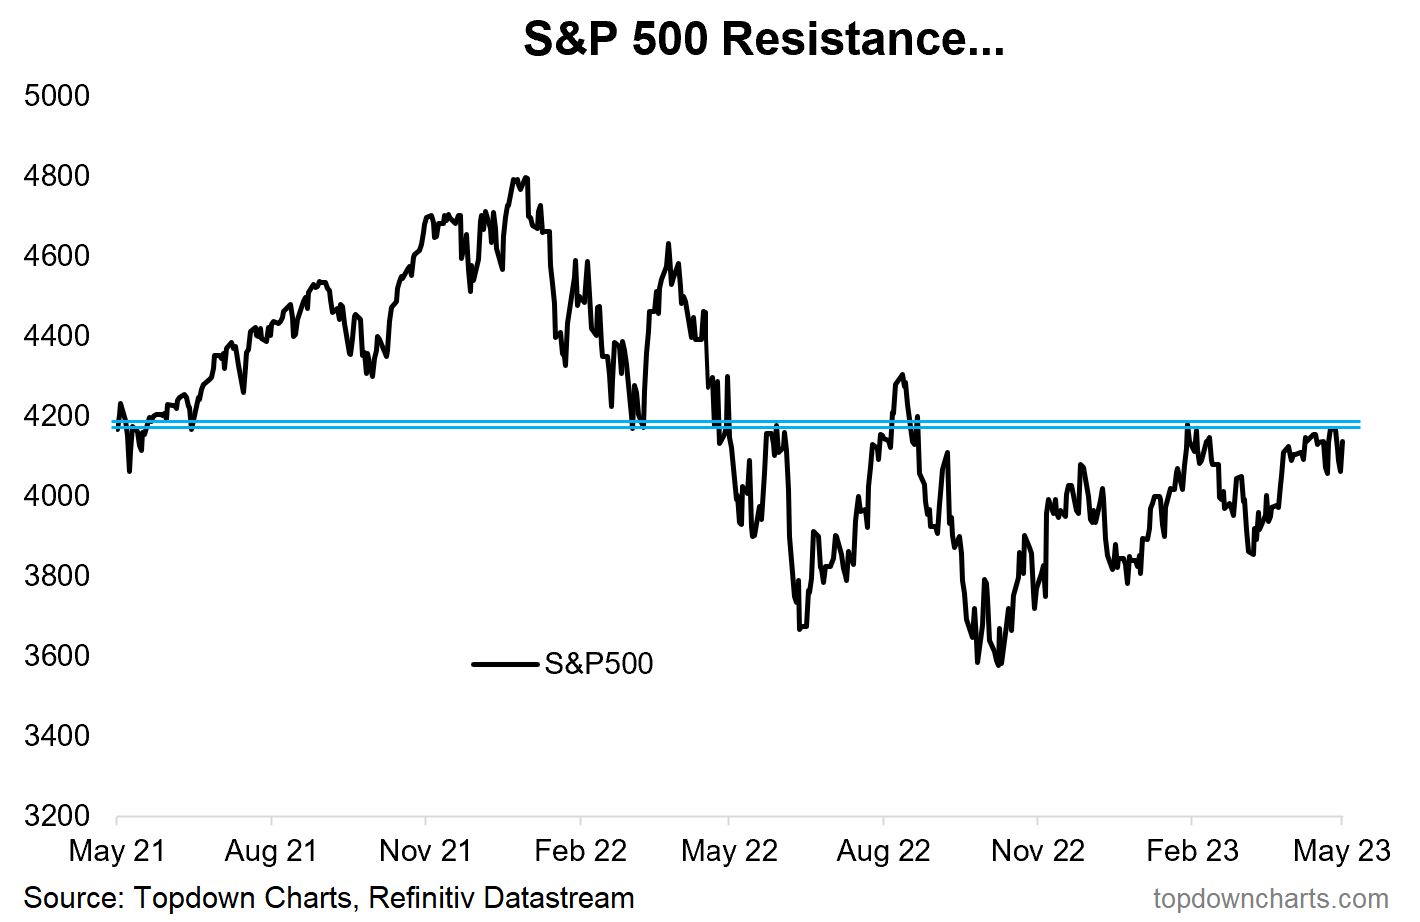
Despite making higher lows and tracking above its 200-day average, the S&P500 continues to struggle with overhead resistance while breadth remains weak.
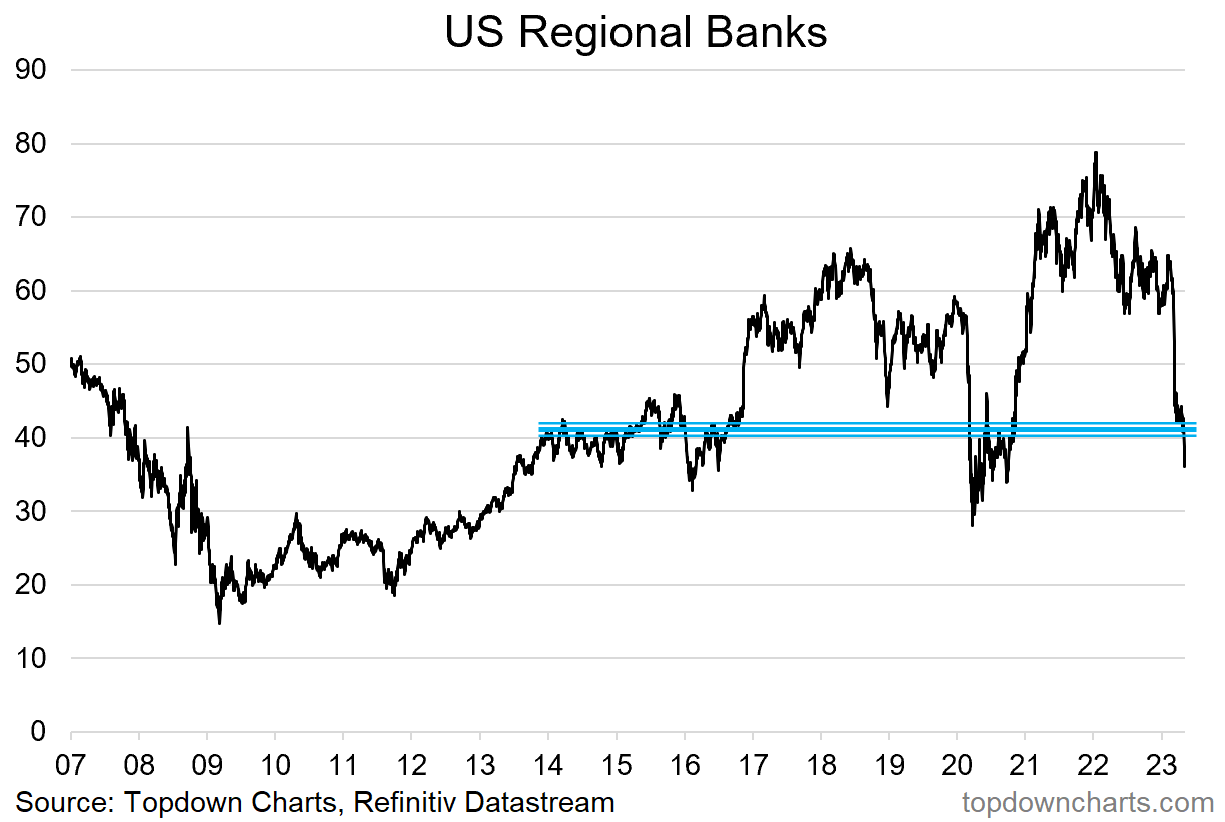
US regional bank stocks took another dive last week (below support), and as such global bank stocks are notably outperforming vs US banks.
Credit tightening and weak demand are two important macro topics that have been increasingly mentioned during corporate earnings calls.
PE ratios are more or less useless for short-term investors/traders (with some exceptions), but very useful for longer-term investors.
Sentiment is closing the previously wide gap vs positioning and economic sentiment catching down to market sentiment.
Overall, just like the macro backdrop — where you can argue that there are clear downside risks e.g. dire leading indicators and yet also clear spots of strength e.g. labor market — the market technicals picture equally offers evidence for bulls and bears alike. The easy answer = more range trading. The hard answer = more patience and attention to the charts & data…
1. Sturdy Ceiling: After a valiant rebound on Friday (and despite the positive AND negative news flow) the S&P500 continues to muddle around below that major overhead resistance zone. The range trade continues — and as Cameron Dawson pointed out: the market has basically gone nowhere over the past 2-years!
Source: @topdowncharts Topdown Charts
2. Wedgie! Zooming out, the market is being wedgied on both sides; the index level (rising wedge/triangle) and breadth (falling wedge). Looking only at the top panel you’d probably say it looks good — the market has avoided making lower lows since “““the“““ bottom back in October 2022, and the 200-day moving average is turning up. But that bottom panel is problematic, and probably needs to resolve to the upside of that bearish wedge if that big old overhead resistance line in the previous chart is to be cleanly cleared.
Source: MarketCharts @Callum_Thomas
3. Bank Bonking: Seems like another week, another bank goes to the wall. This time First Republic Bank (which ended up in an arranged marriage with JP Morgan). As such, US regional bank stocks took another leg down, below support — but still above the 2020 and 2016 lows. Again, my view on this is that zooming out it’s sort of natural to expect to see financial system stress as monetary policy tightens (the flipside of the procession of mini-bubbles during 2020/21). I would note though, that for now this is not a credit quality issue (that sort of thing typically comes later in the cycle). But with monetary policy still tightening I would be hesitant to go bargain hunting in banks outside of very short-term bounce trading.
Source: @topdowncharts Topdown Charts
4. Global vs US Banks: To carry that point a little further, this is also basically just a US bank issue (little global contagion or simultaneous stress elsewhere at this point) — as such, global bank stocks have gained the upper hand vs US. Looking at the longer-term run of relative performance for global vs US banks it echoes the trends in global vs US equities (which goes to show it’s not just a tech thing). And another thing, that sure does look like a multi-year turning point…


