
Weekly S&P500 #ChartStorm - 7 March 2021
First edition! (by email)

So this is the first one I’m sending by email. First is always going to be messy and rudimentary, but the main thing is getting the charts in and sent/received all good. That’s the measure of success for now…
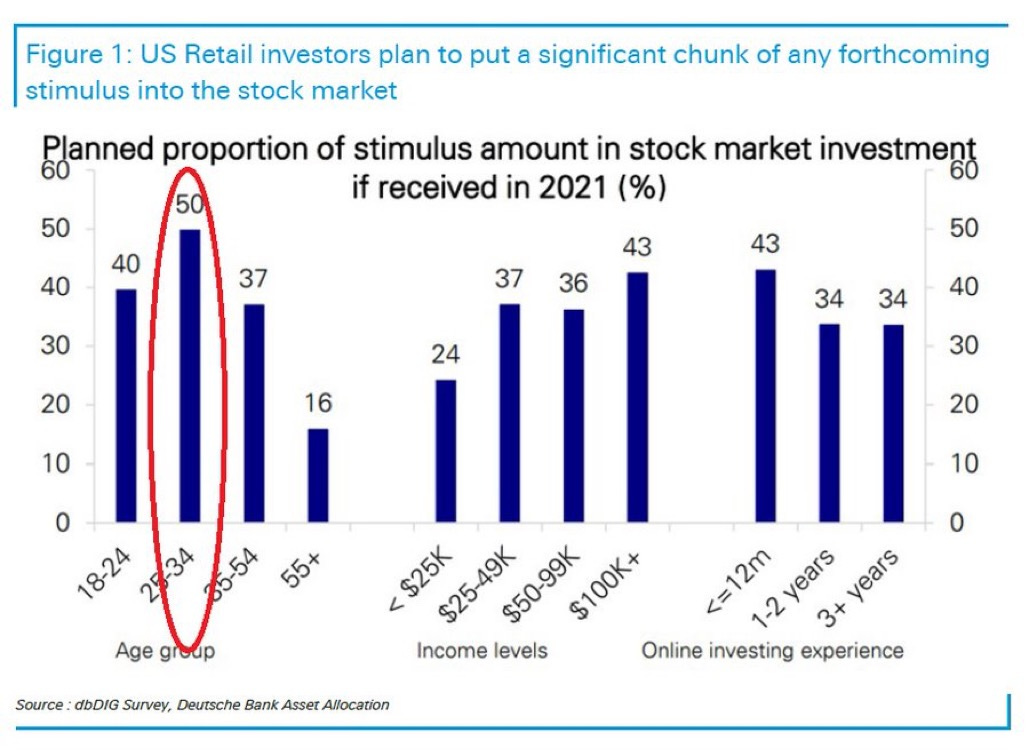
1. Stimmy is coming...
h/t @NorthmanTrader
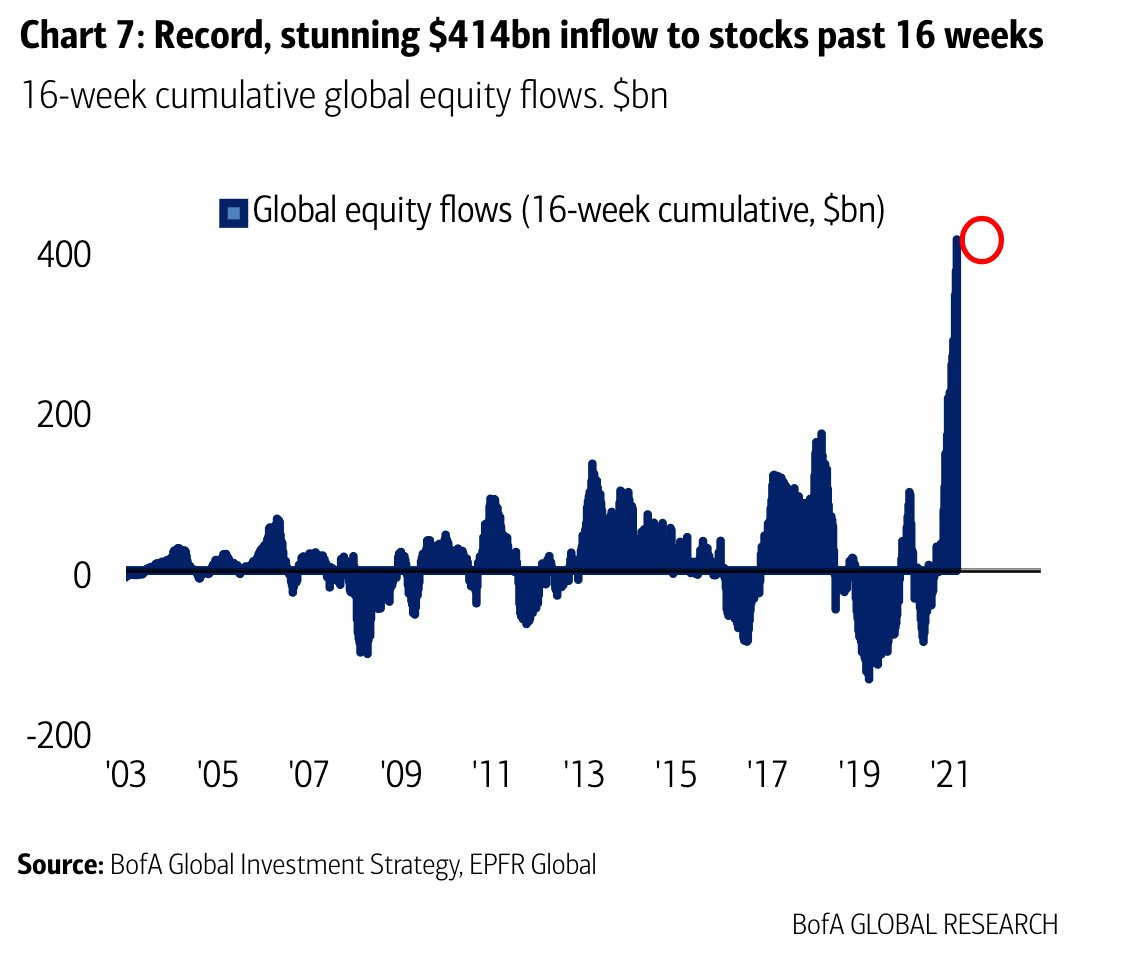
2. Go with the flow?
h/t @RobinWigg
3. Buybacks are back.
h/t @MikeZaccardi

4. Buyback index: massive turnaround in performance.

5. Short-Surge!
Bears are thirsty... big surge in inverse-equity ETF value traded last week (similar in scale to corona crash)

6. Showing discretion?
Discretionary traders = all-in
Systematic = sidelines h/t

7. Retail exposure fairly all-in also...
(albeit, still not at the very top of the range, so could argue there is room to move all-inner)

8. SPAC issuance… #NewParadigm
h/t @PriapusIQ

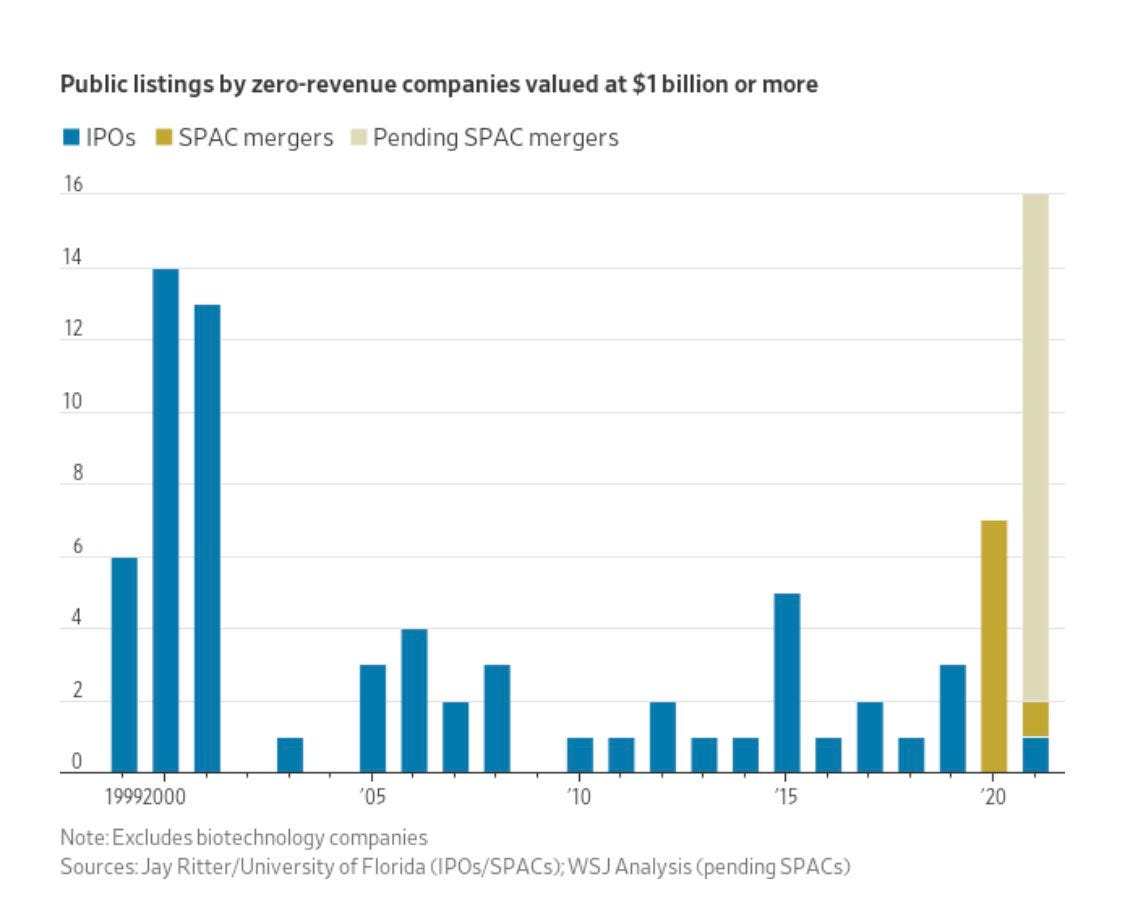
9. Surge in zero-revenue $1b valuation companies going to market.
If you were going to raise, there hasn't been a better time in recent history
h/t @CNBCJou
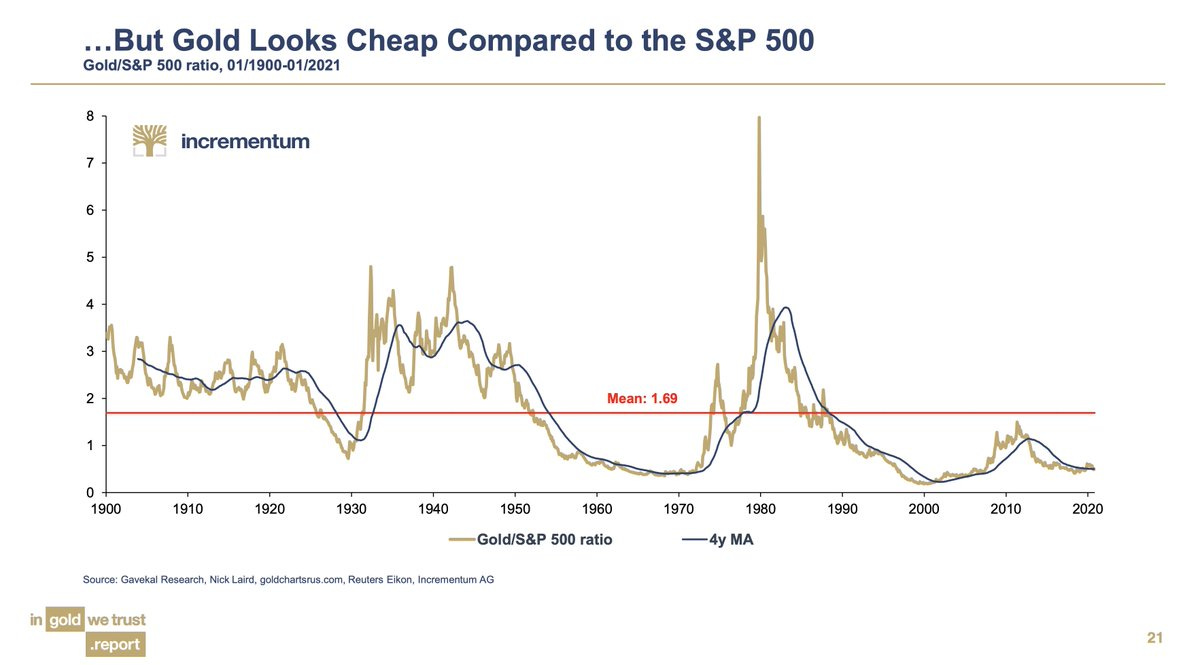
10. Gold cheap vs stocks?
h/t @jessefelder & @RonStoeferle
So that’s it for this week.
Really just a test run this week to make sure all the charts are showing up and sending alright (let me know if there are any issues in viewing the charts).
Thanks for following, I appreciate your interest!
oh… that’s right, almost forgot!
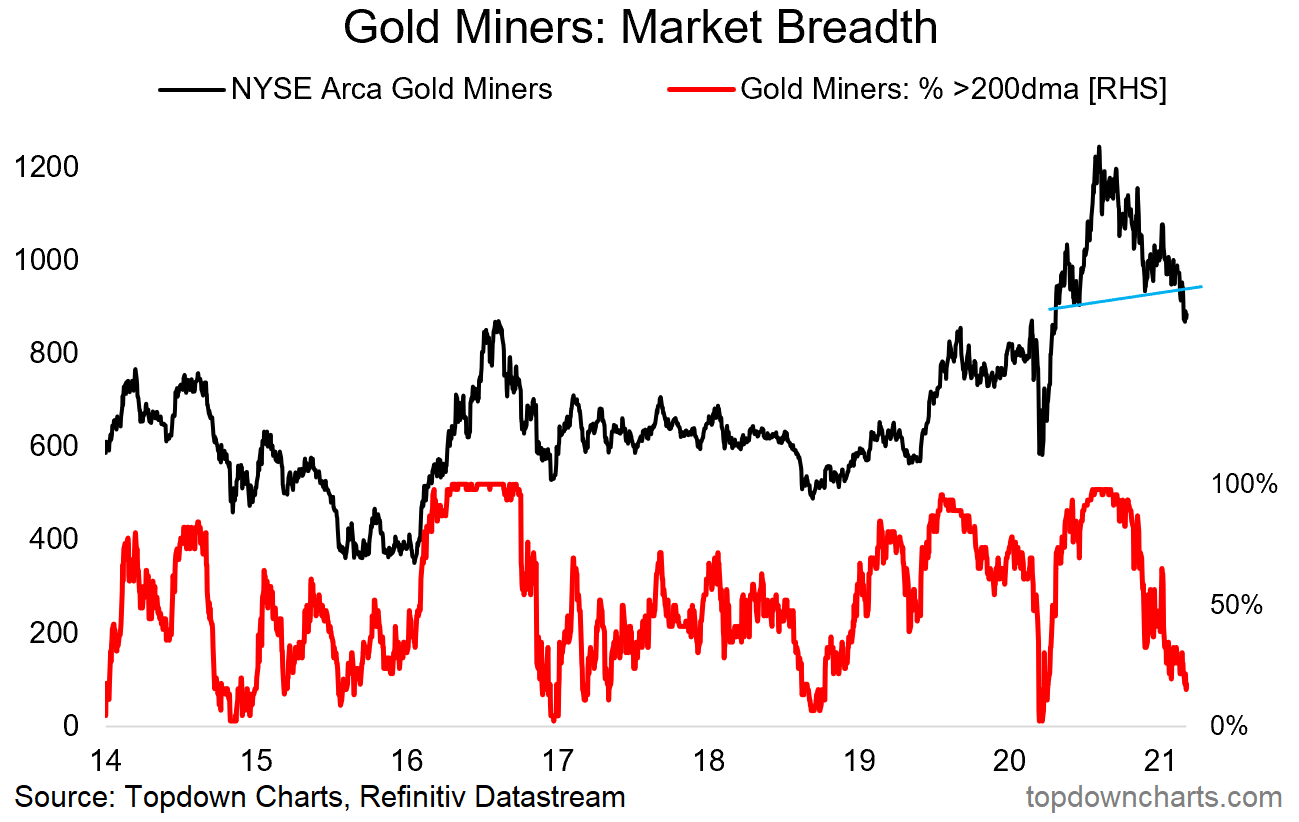
BONUS CHART >> got to include a goody for the goodies who subscribed.
This is something I had spotted a week or so back, I was looking at gold miners given the carnage in the stocks and the gold price. It’s probably a buy at some point, but what I found interesting in this chart is the apparent “Head and Shoulders“ top.
You’ve probably seen the H&S charts on the Nasdaq/Tech stocks, but probably not seen the H&S on gold miners. So maybe too early to catch this falling knife…
Best Regards,
Callum Thomas