
Weekly S&P500 ChartStorm - 6 October 2024
This week: tech try, financial conditions uneasing, earnings, election, seasonality, rate cut cycles vs market cycles, sentiment, shareholder yield, Chinese stocks, allocations...

Welcome to the latest Weekly S&P500 #ChartStorm!
Learnings and conclusions from this week’s charts:
Financial conditions have un-eased.
Important resistance levels remain un-cleared.
October seasonality is bearish during election years.
Investors are all-in on stocks (and valuations are high).
We’ve never seen Fed rate cuts when valuations are this high.
Overall, there still seems to be a lot of unfinished business in the market. Technicals and macro remain mixed, valuations/sentiment/allocations elevated, and various (geo)political risks looming. Maybe it’s actually a positive sign that the market has done so well all things considered. Either way I still think the two R’s of risk management and rotation should be front of mind.
REMINDER: the new Weekly ChartStorm Chat-Room is now up and running — I will host a live Q&A session on Sunday evening about 9pm EST.
1. Tech Trying: Tech continues to try to regain its status as the leader of the US stockmarket, but remains stuck around that key overhead resistance point. Market breadth likewise remains stuck around the 60% mark. If we ignore macro and valuations and just focus on trend, you might argue that it will eventually resolve to the upside. But there are a few things going on…
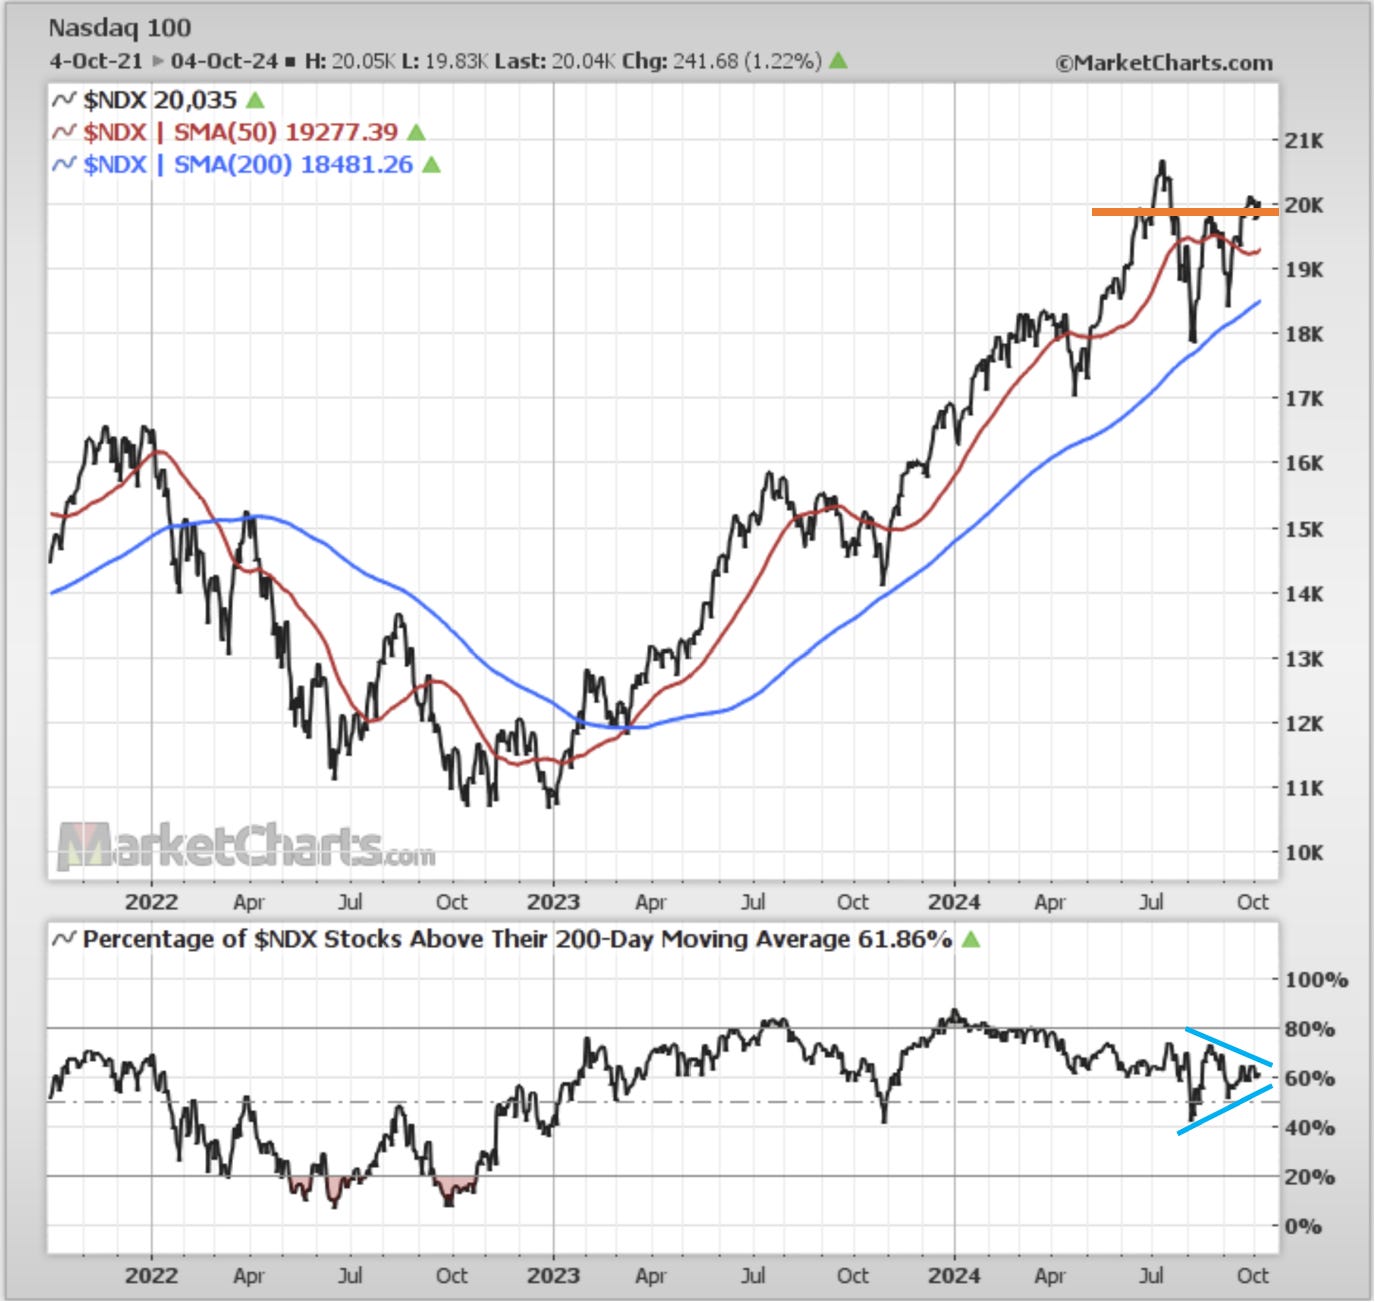
Source: Callum Thomas using MarketCharts.com Charting Tools
2. Financial Conditions Uneasing: As a follow-up to last week, this chart is looking less bullish now. The previous easing of financial conditions has unwound somewhat with the US dollar, bond yields, and oil price rebounding. It raises several specters; geopolitical risk (oil), resurgence risk (dollar, rates), and overall macro headwinds into a seasonally sketchy time of the year.
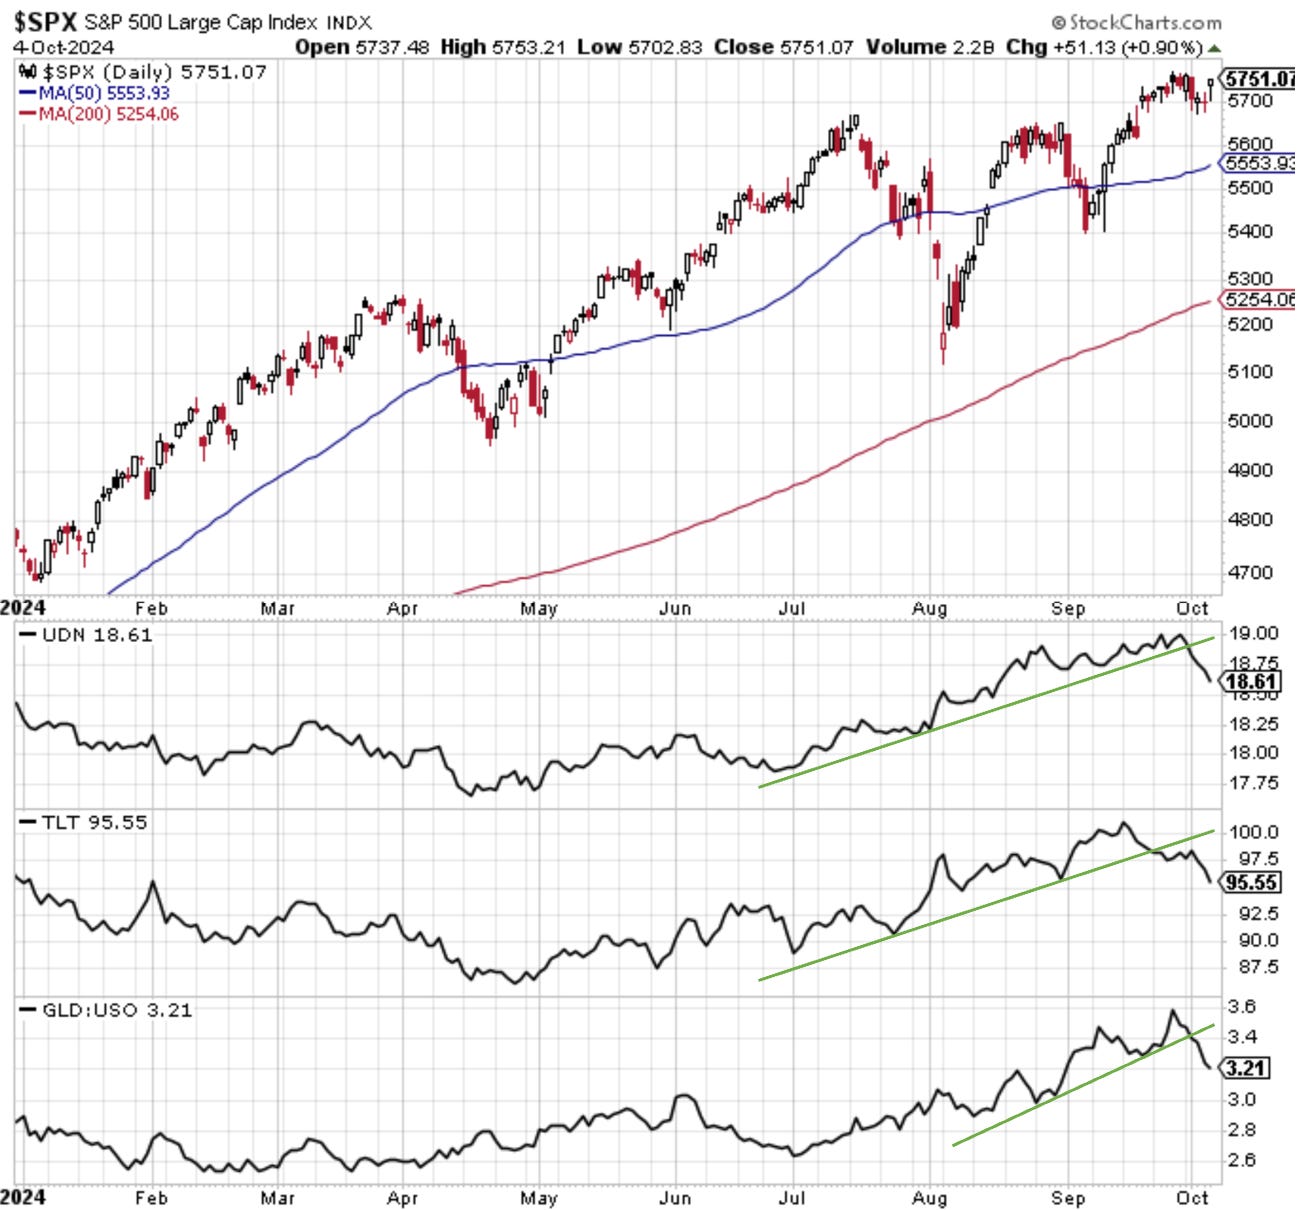
Source: @Callum_Thomas using StockCharts.com
3. Earnings Season: Meanwhile, earnings season is set to kick-off next week, with Friday’s financials (JPM, WFC, BLK,BK) potentially setting the tone for what to expect with the Q3 reports. If the Fed is right in its assessment that the economy is losing momentum, we might see some disappointments. But we likely won’t get the full picture until later in October.
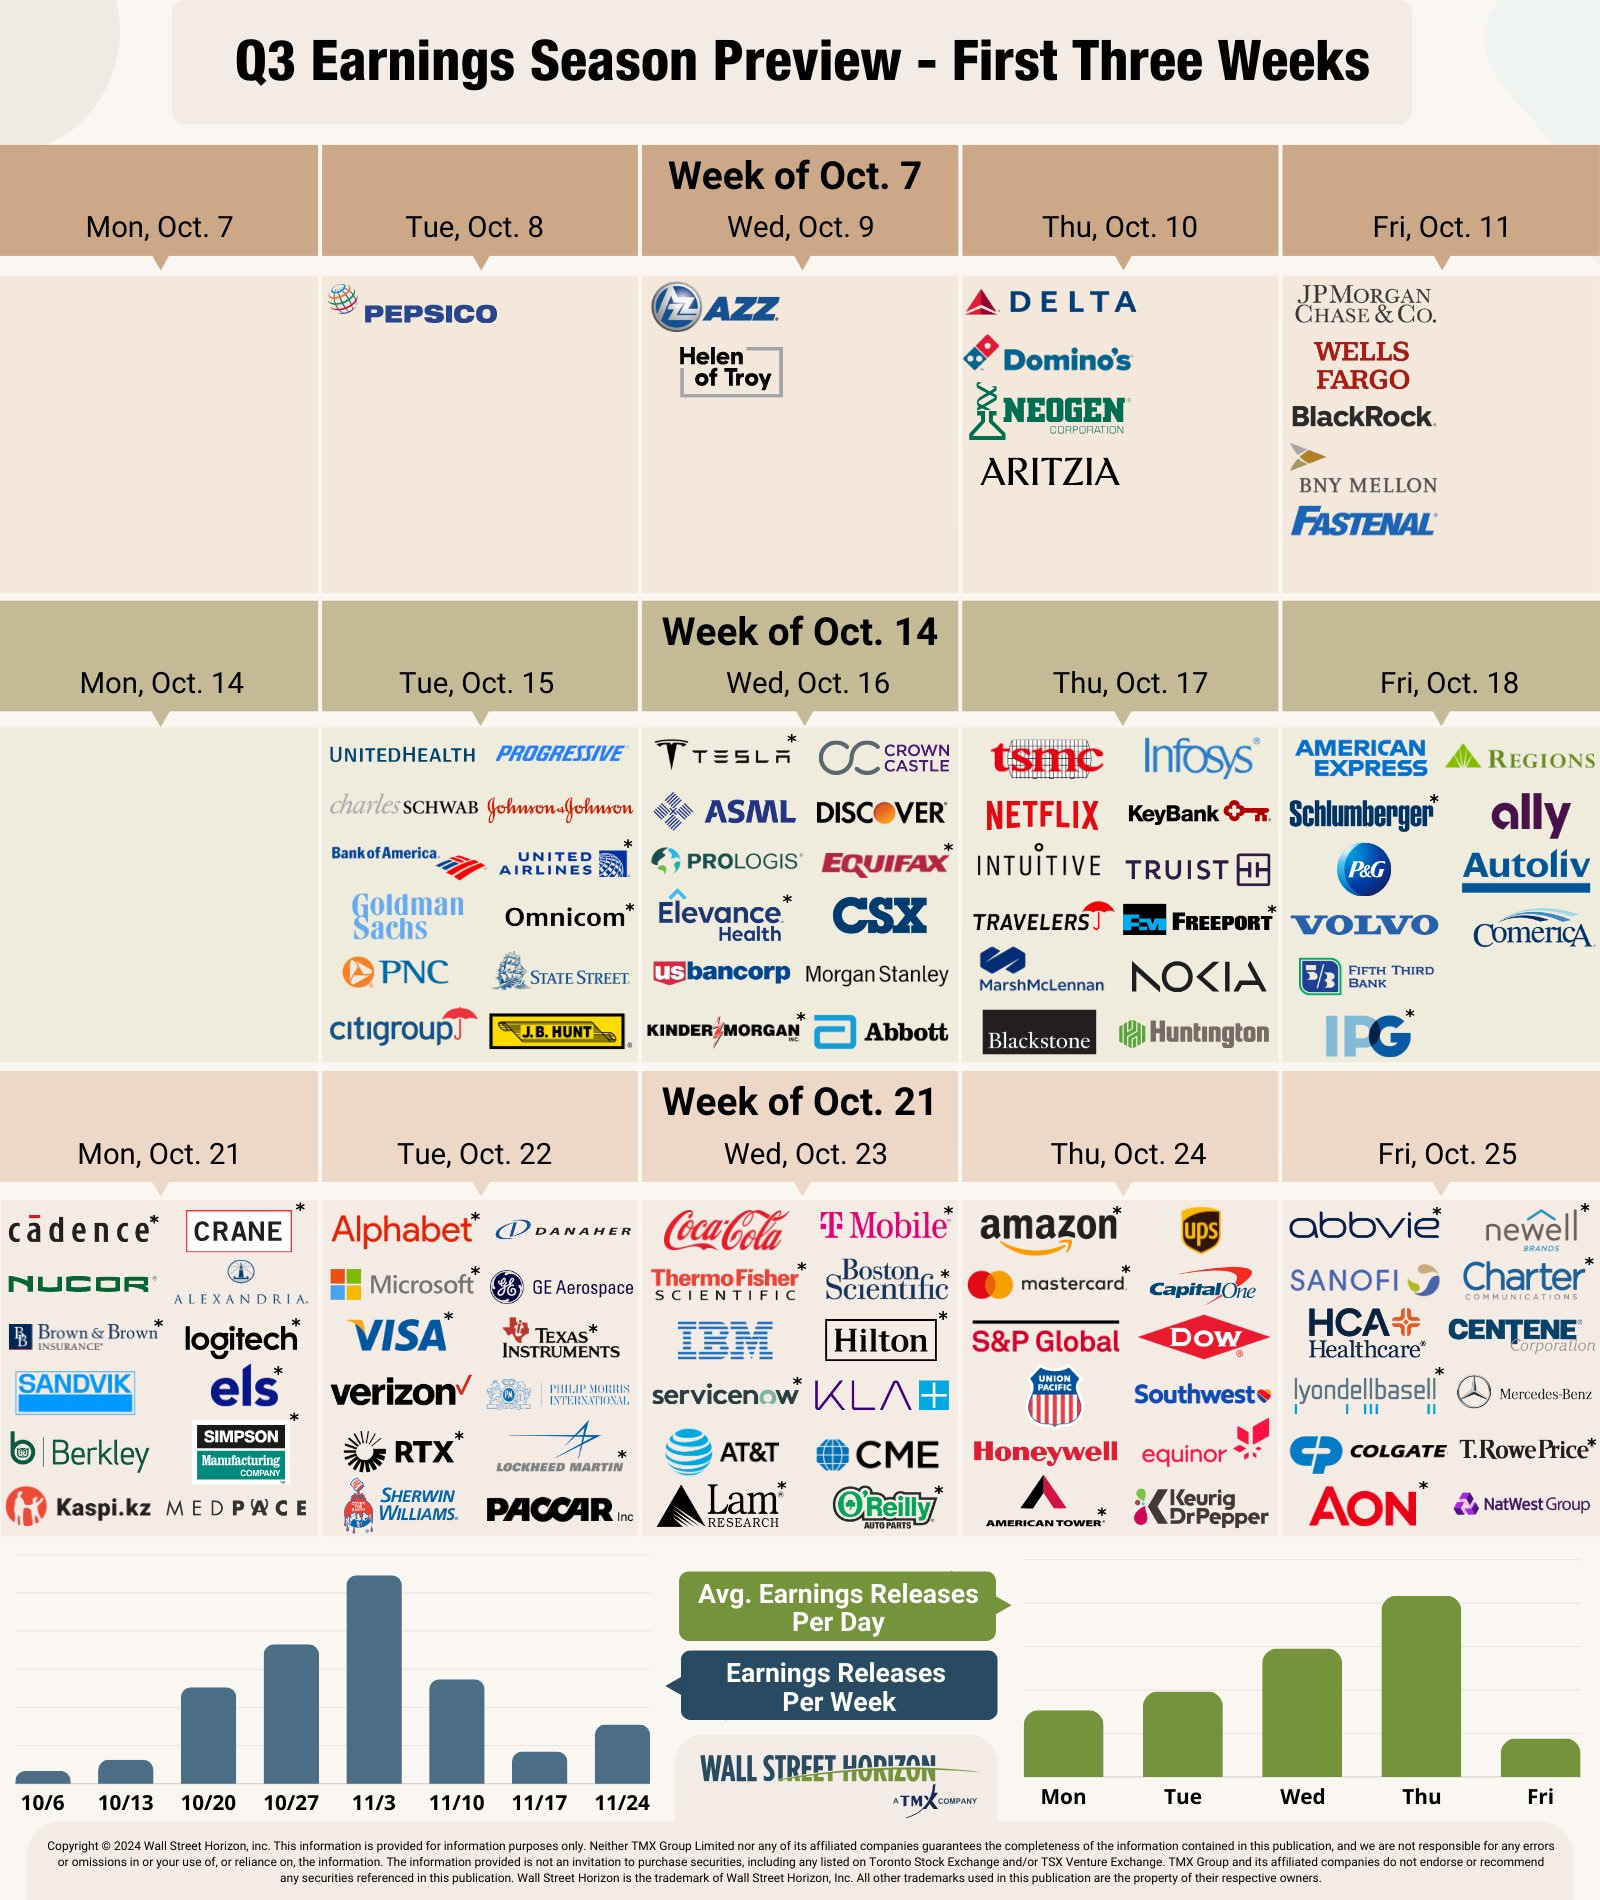
Source: @WallStHorizon
4. October Surprise? Meanwhile, as noted seasonality is generally bad during October in election years. We are heading into the peak period of uncertainty, and no doubt many twists an turns into the final stretch of the election campaign (not to mention the various macro/geopolitical risks lurking in the background).
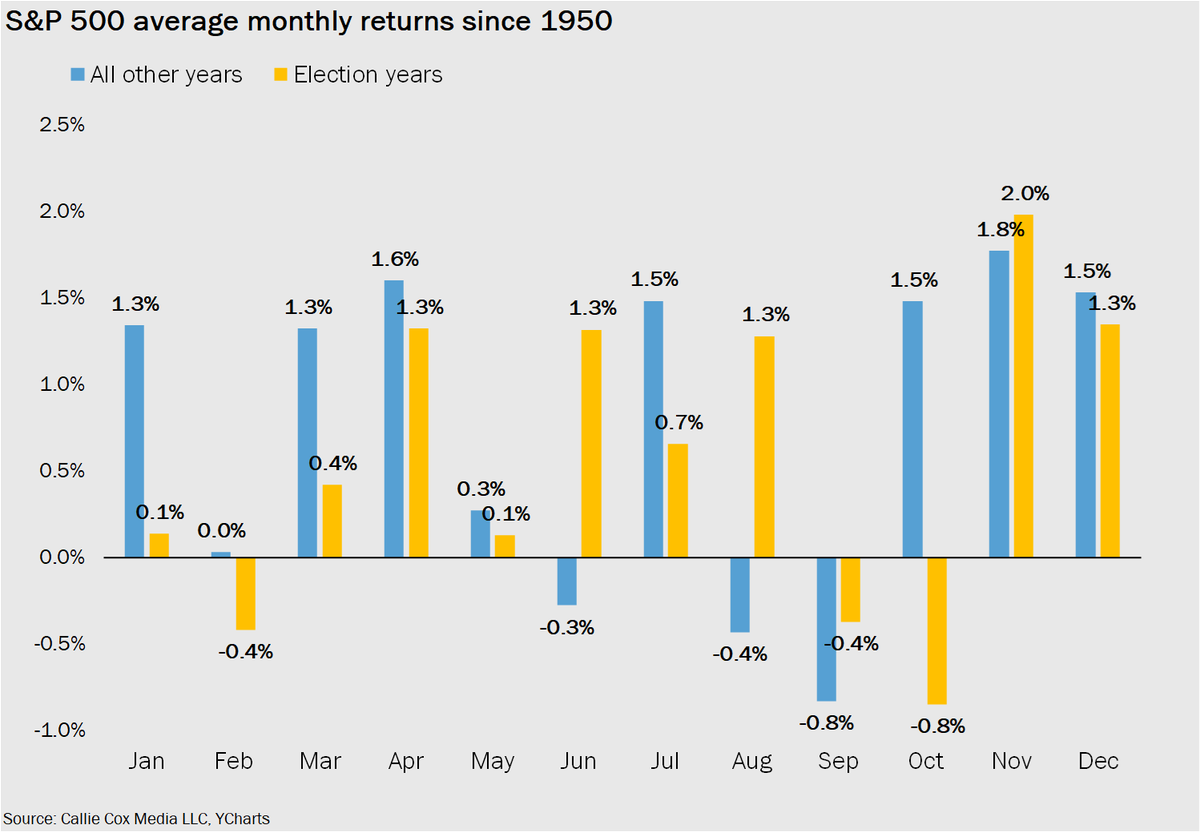
Source: @callieabost
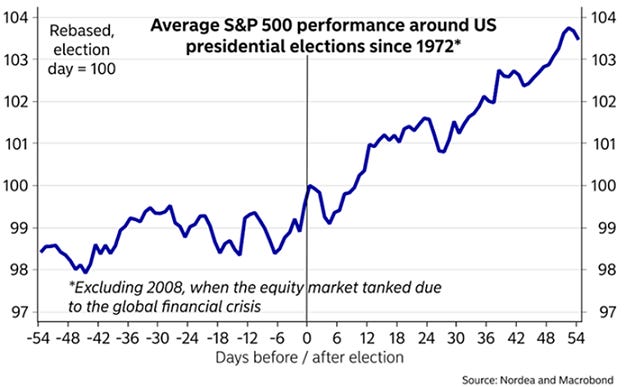
5. No Contest: But from an optimistic standpoint, after the election we tend to see a clearing of risk, and then focus will shift to the typical year-end rally.
(But what if it’s contested? —and let’s face it, odds are it will be. So it may be too soon to say whether uncertainty will actually fade entirely post election day!)
Source: Twitter post 15 Nov 2020
6. Rate Cut Heights: Back onto rate cuts, this thought-provoking chart shows a sampling of where valuations were tracking at the time of the first Fed rate cut during previous rate cycles. Bears will say it’s 2000 all over again. Bulls will say it’s 1998. I will say, let’s look at the next chart to get a bit more context.
