
Weekly S&P500 ChartStorm - 5 November 2023
This week: technical check, failed breakdowns, green lights, seasonality, sentiment, cash allocations, top heavy markets, long-term cycles, stocks vs bonds, 60/40...

Welcome to the latest Weekly S&P500 #ChartStorm!
Learnings and conclusions from this week’s charts:
Last week the S&P500 rebounded sharply after chalking up a series of failed breakdowns — setting a decidedly bullish technical tone.
The sharp tightening of financial conditions has reached a peak.
Seasonality is turning positive, and sentiment has materially reset.
The S&P500 is still heavily lopsided, with the increasingly big “big tech” taking a disproportionate market cap share vs earnings.
Beware of recency bias as a number of longer-term market cycles are looking long in the tooth (US vs global, tech vs non-tech, stocks vs bonds).
Overall, the price action of the past week struck a decidedly bullish tone. Peak geopolitical fear, possible peak in Fed rates, and short-term peak in financial conditions tightening… along with a reset in sentiment + positive seasonality sure makes it easy to believe in a year-end rally. Will it really be that simple?
1. Green Lights: This chart combines a couple of things I’ve been tracking in recent weeks — first is that downward sloping trendline: we’ve just seen not only a bounce off that line but also a failed breakdown through it (and the 200-day average), and the market even edged back up above its 50-day moving average. Looking at the lower panels, the first shows TLT 0.00%↑ (basically bond yields inverted) which has tentatively broken its downtrend, the second shows UDN 0.00%↑ (basically US Dollar inverted) turning the corner, and then finally XLK 0.00%↑ vs XLE 0.00%↑ shows tech stocks shaking off their bear run and crude oil prices coming off the boil. Overall representing a peak in that previous tightening of financial conditions (where crude oil + bond yields + US$ were all going up), and taken as a whole it’s a fairly bullish looking picture.
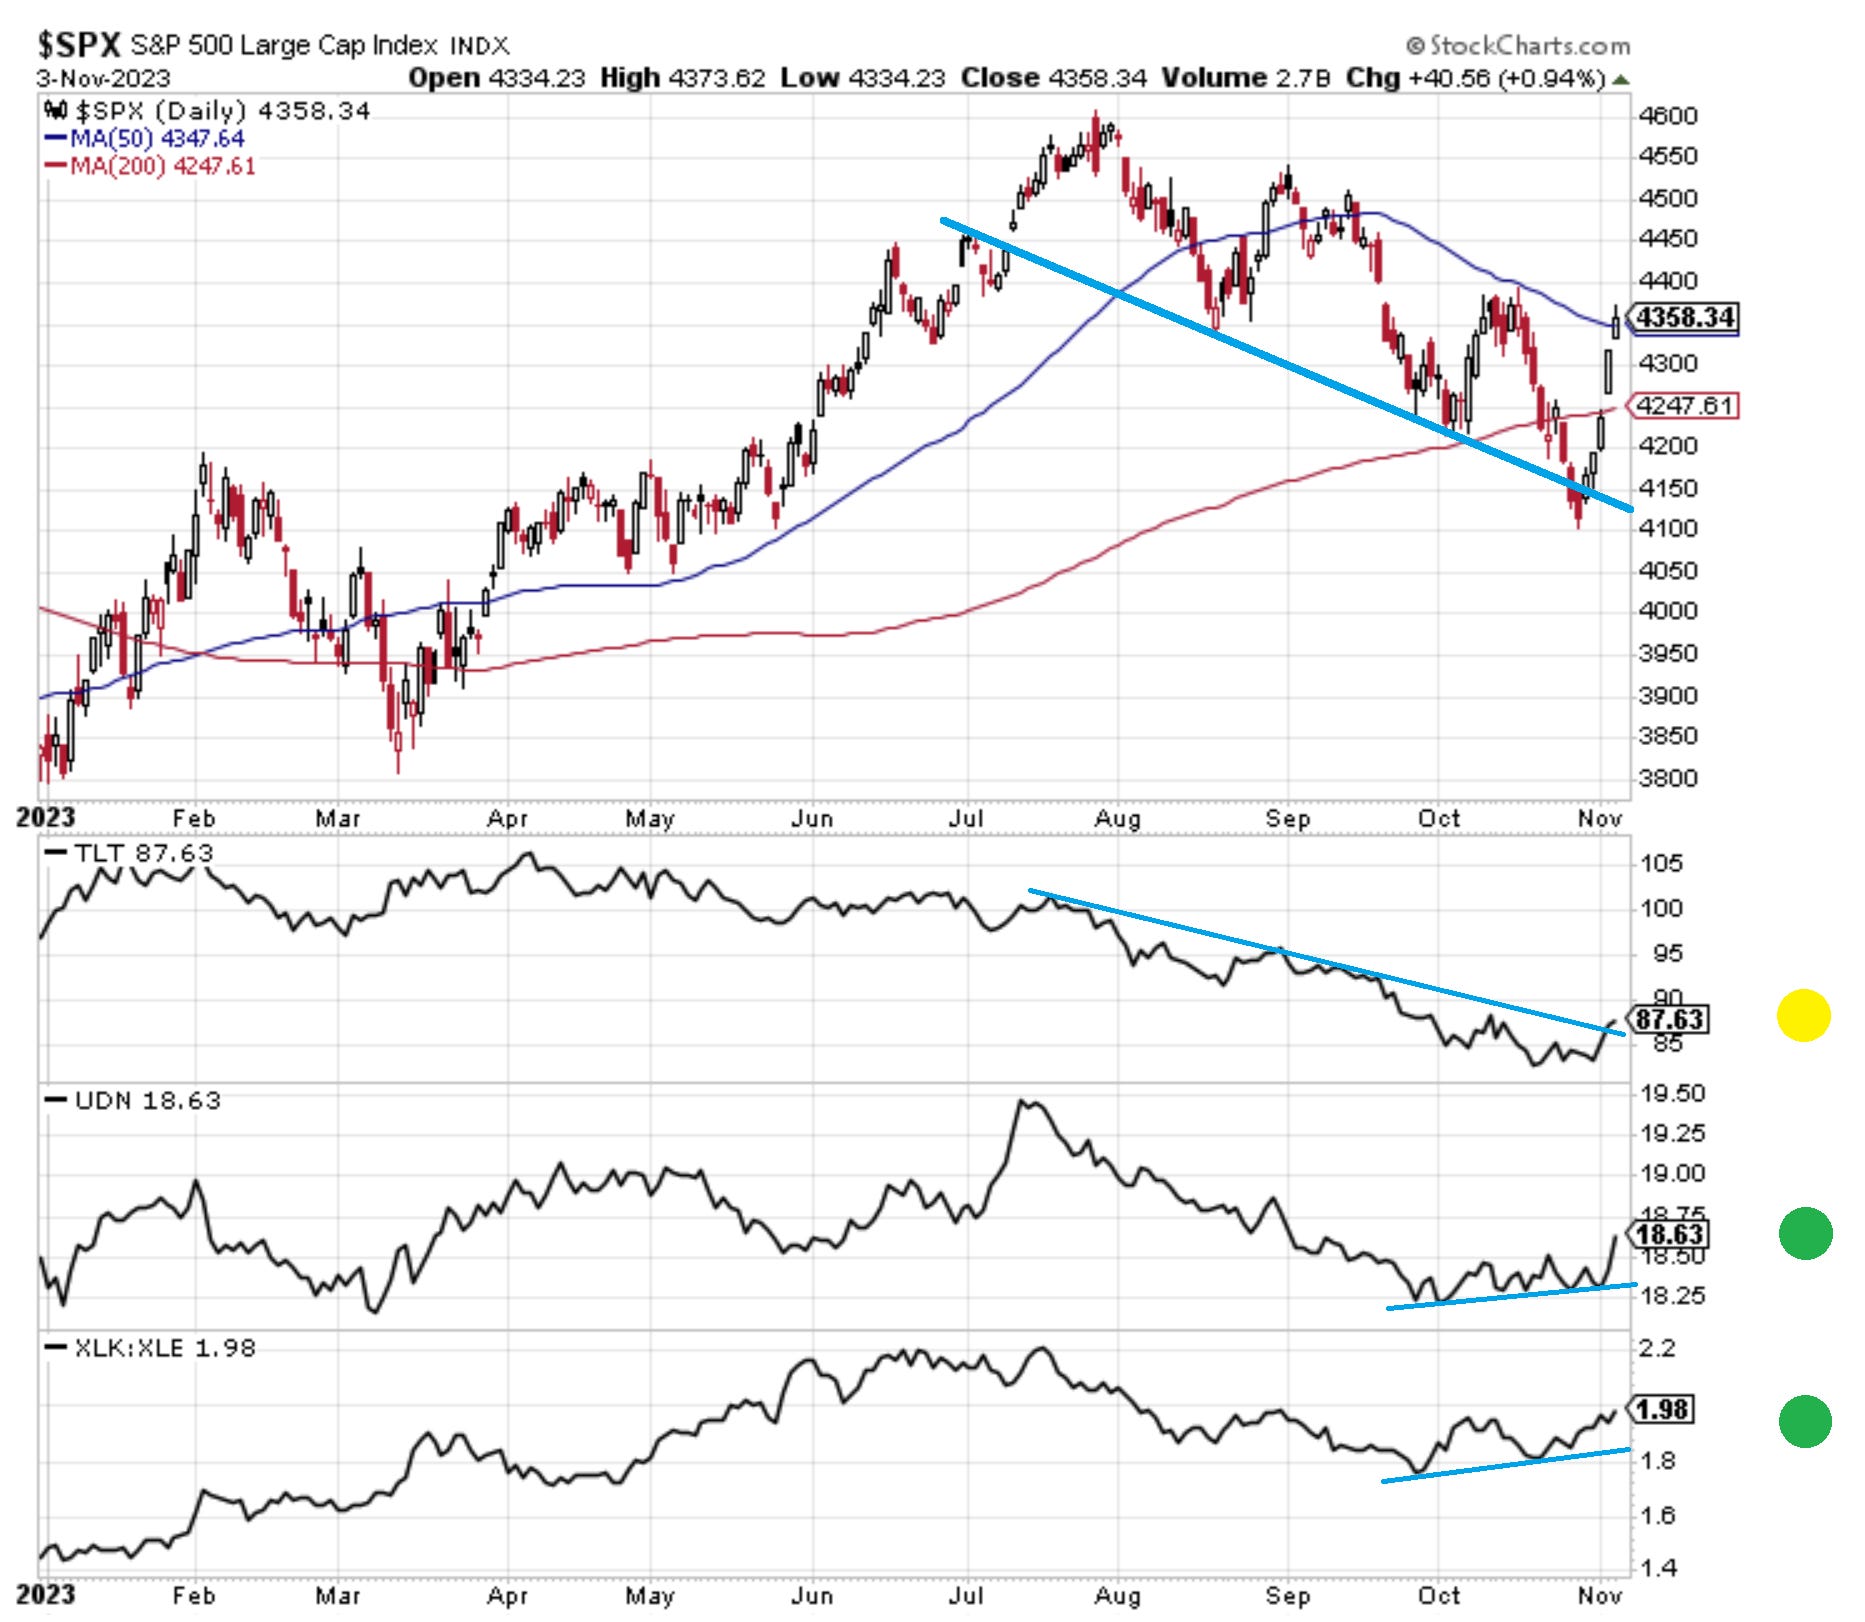
Source: Callum Thomas using StockCharts
2. Failed Breakdowns: On a similar note, and also following-up on a previous running feature, this chart highlights how along with the failed breakdown below its (upward sloping) 200-day moving average the S&P500 also chalked up a failed breakdown below that key support level [n.b. notice how it did the same thing in reverse last year — poked its head above the 4200 level and got shot back down]. But also the breadth of stocks trading above their respective 200-day moving averages has made its own failed breakdown, and is now turning up from basically oversold levels. Again, strictly on technicals and knowing nothing else, this looks good.

Source: @Callum_Thomas using Market Charts
3. Et tu, Santa? Along with all that we’ve got positive seasonality coming online, with the increasingly hyped “Year-End Rally” coming into focus. In terms of monthly returns, across all years (from 1964-2022) the S&P500 turned-in positive returns across November and December 68% and 71% of the time respectively… those are good odds.

Source: Topdown Charts
4. Sentiment Reset: The other interesting piece of context alongside the previous points is how sentiment has reset significantly (albeit not yet to extreme bearish) from previous optimism.

Source: Topdown Charts using data from Consensus Inc.
5. Cash/T-bills on the Sidelines: Investor allocations to cash have increased significantly (as you might expect given the relatively decent risk-free returns offered by cash investments). Perhaps another argument for a larger rally into year-end.
