


Weekly S&P500 ChartStorm - 5 May 2024 [free version]
This week: technical check, emerging markets, small vs big margins, Europe vs US, fund start-ups, job stats, Buffet compounding, effective interest rates...

Welcome to the latest Weekly S&P500 #ChartStorm! [free version]
Learnings and conclusions from this week’s charts:
The recovery from correction still faces two important hurdles/tests.
Emerging market equities meanwhile are breaking out.
Large cap profit margins are more than twice that of Small caps.
Hedge fund starts are down, but active ETFs are surging.
Trailing effective interest rates are up notably.
Recommendation — Behind The Balance Sheet
Check out
by — Steve provides excellent insights on analyzing companies and compelling institutional-grade courses on bottom-up stock picking fundamentals. A great compliment to the existing top-down insights you get from the Weekly ChartStorm!ALSO, while it is late notice, Steve will be running an Accounting Red Flags seminar in Omaha Nebraska on Sunday May 5th at 2pm — See Details (for those who might have made the trek to the BRK meeting).
1. Mixed Signals: So we got a resolution to that bearish divergence (i.e. the previous higher highs on the index vs lower highs on the breadth indicator) in the form of a >5% correction. So far we have seen little damage done to the trend (by contrast over 70% of stocks are tracking above their 200-day average, and the index itself is above the upward-sloping 200dma), but in the short-term the market is still dealing with the double resistances of the 50-day moving average and the ~5150-level. Whether or not we break back above those hurdles is going to be key in setting the tone for the next phase of the correction process (recovery vs risk).

Source: @Callum_Thomas using MarketCharts charting tools service — NOTE: this is one of my favorite charting tools, they have excellent breadth indicators, easy to use web-based charts, and pricing is quite reasonable.
Highly recommended (click to trial)
2. Emerging Breakout: Elsewhere, things are looking decidedly risk-on for emerging markets, where the index has just undergone a key breakout. It’s a helpful signal to the S&P500 for other risk assets to be rallying like this, but I wonder if this one is more of a case of rotation opportunity vs a bullish intermarket signal for the US as such.
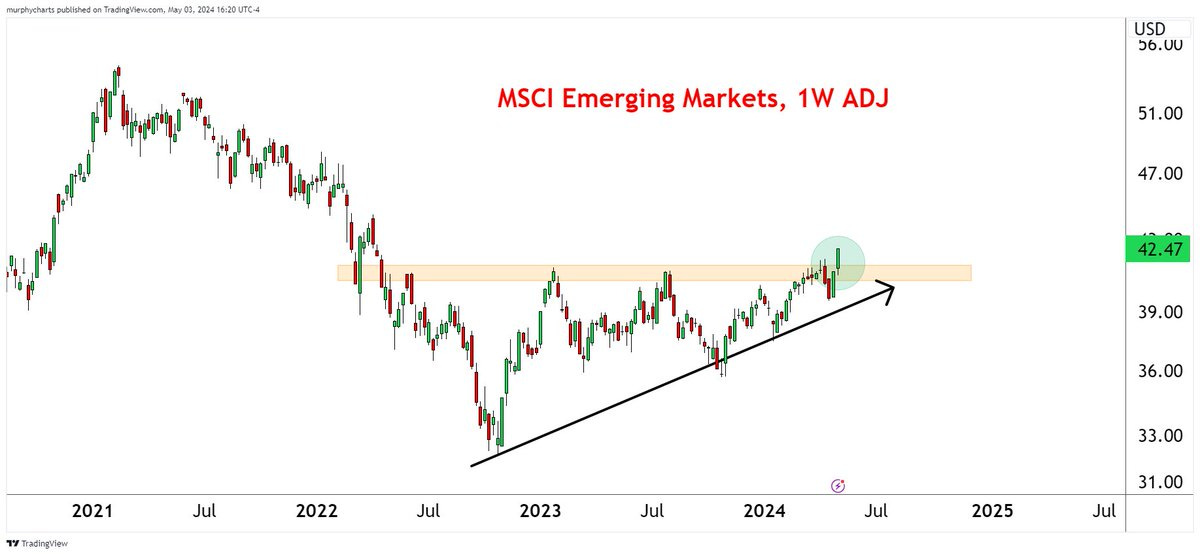
Source: @murphycharts via @TheChartReport
Reminder: Subscribe to the [Free] Chart Of The Week
Gain access to original macro/market charts + insights from
3. Old News? And another thing on Emerging Markets, they actually already broke out a few weeks ago in local currency terms, with an upward sloping 200-day moving average, and with expanding 200-day moving average breadth. From a technicals standpoint this is a pretty clear picture of emerging strength.

Source: Topdown Charts Topdown Charts Professional
4. EM vs US: But before you get too excited about a possible rotation for EM vs US, take heed of this chart — yes it shows we are at the bottom end of the long-term range, and hence it’s as good a time as any to turn the corner… But it also serves up a cautionary in the 50’s and 60’s that the turning process for things like this can be a multi-year work in progress.
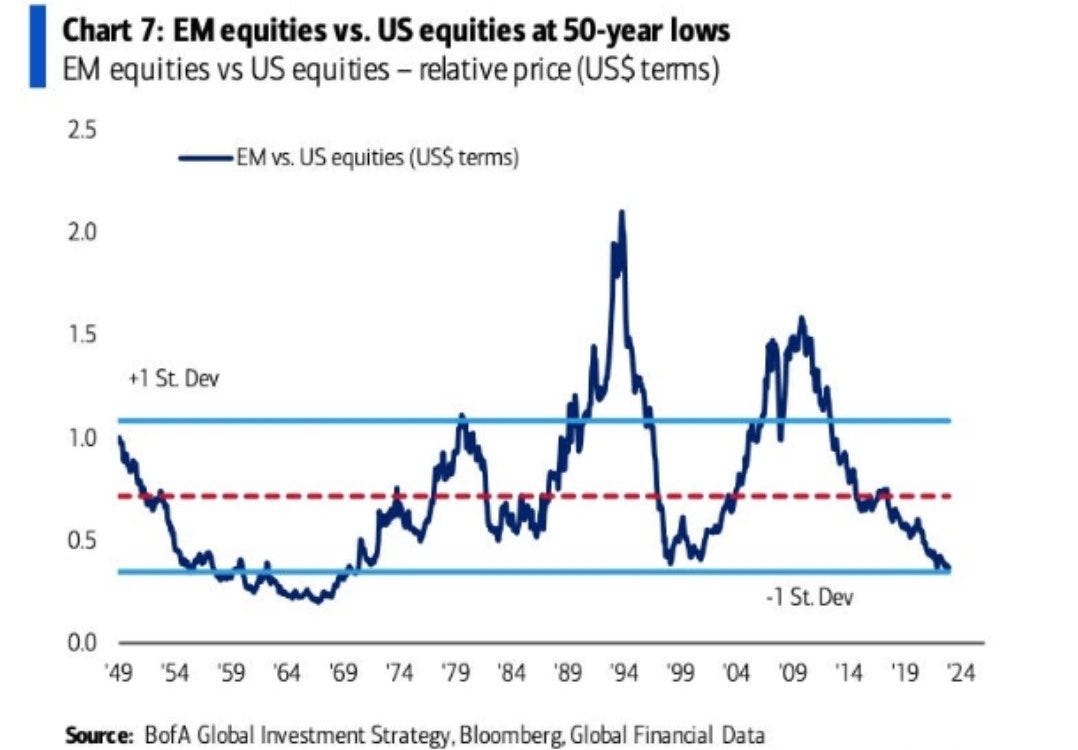
Source: @MichaelAArouet
5. Large Margins: Speaking of relative performance, and following on from the charts and comments on Small Cap Stocks from last week, this chart adds some important context. Small Caps almost consistently have lower profit margins than large caps — maybe good evidence of economies of scale and monopolistic earnings advantages. But also note there does appear to be some cyclicality, and if we were to track the spread it seems like it would be at an extreme/nadir for small vs large.
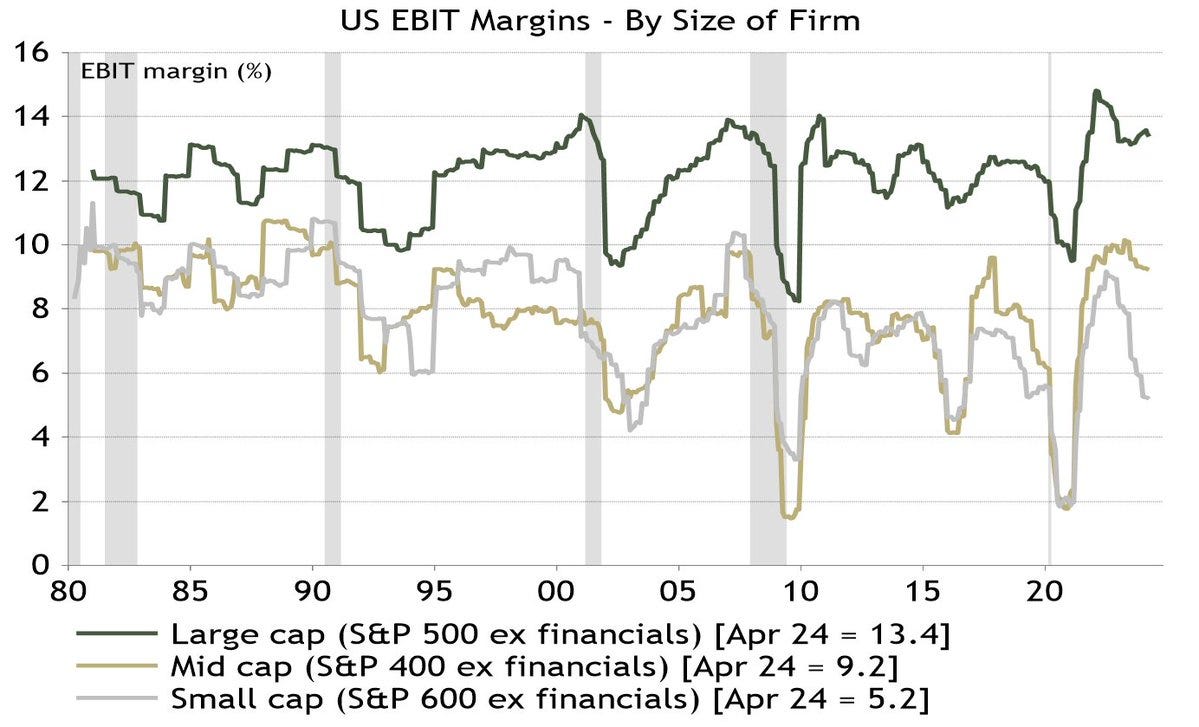
Source: @IanRHarnett
ALSO - IN CASE YOU MISSED IT…
Weekly ChartStorm - Special Rates for
Hi there, Please find below a few options to help make it easier for people to subscribe to the Weekly ChartStorm. But it’s not just about offering discounted rates, there is also an easy option to purchase group/corporate subscriptions for multiple users
6. Something Happened in 2009: European equities used to be good — more or less as good as US stocks. But something(s) changed in 2009. One issue was that Europe had to deal with the hangover from the credit boom, with rolling sovereign debt crises and structurally lower growth as it digested malinvestment and deleveraging. The USA on the other hand saw years of easy policy, and in some ways benefited from the European crisis (fund + talent flows, and excuses to run easier policy persisted). Not to mention the striking of tech-stock-oil (the emergence of a stable of semi-monopoly big tech companies). Quite interesting to reflect, but also a prompt to consider how the next period might unfold.
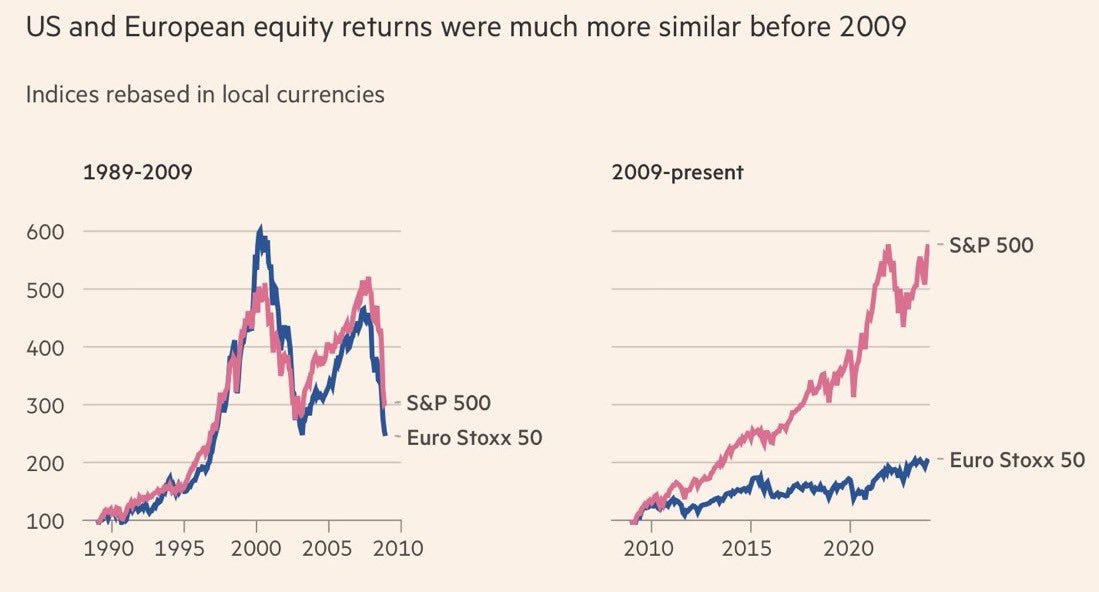
Source: @MichaelAArouet
7. The Stockmarket is not the Economy: They always rattle off that line, but here’s one area where it is clearly true — Despite the total US market cap being over 180% of GDP, S&P 500 companies only account for 18% of total US employment.
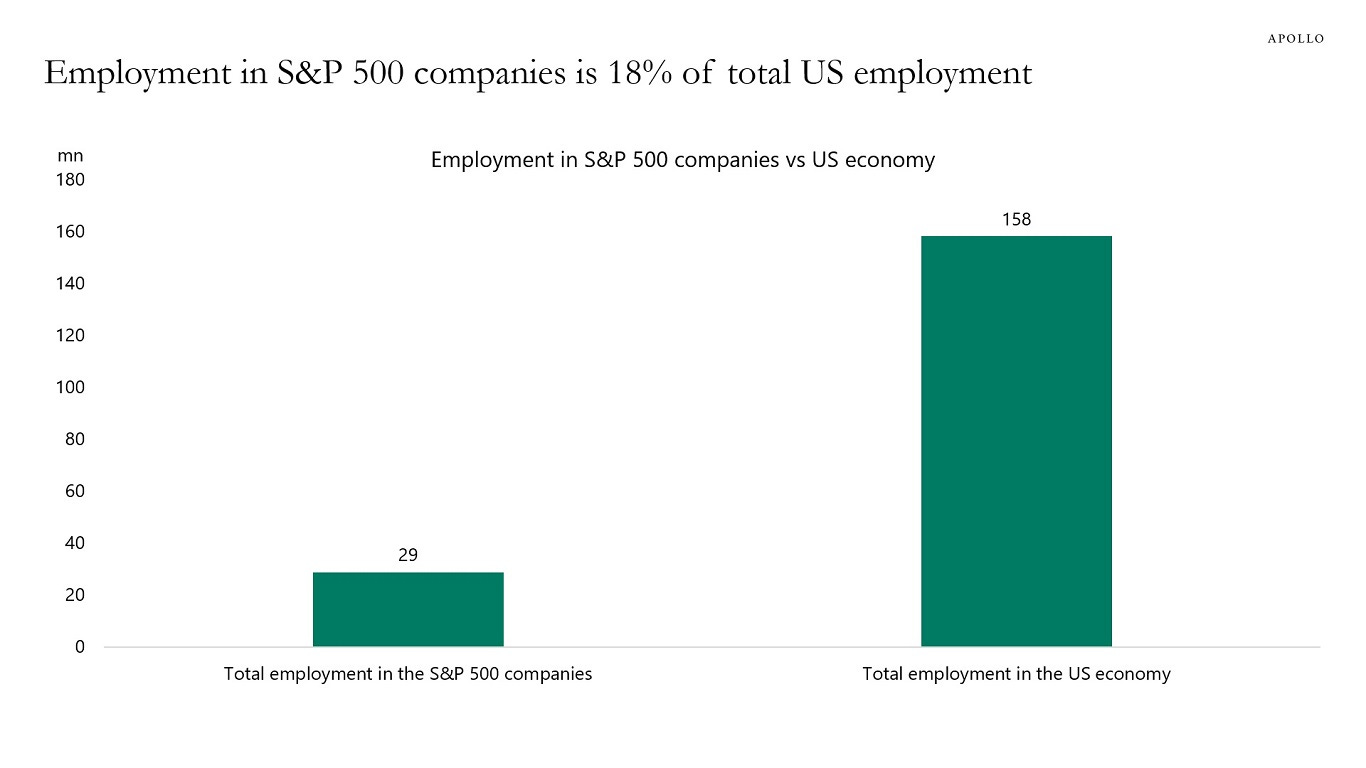
Source: Torsten Sløk
8. Hedge Fund Hell: The hedge fund industry continued its decline through 2023, with the year marking the lowest number of fund launches since the late-1990’s. The headwinds of fee pressures and cheap beta and the push to private markets by asset allocators have made it difficult for aspiring hedge fund managers.
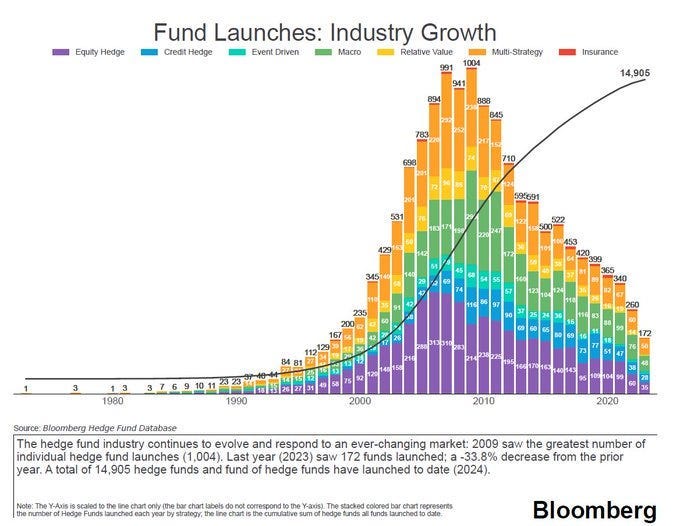
Source: Andrew Sarna
9. Active ETFs Activate: On the other hand, active ETFs have taken off. Goes to show, you can either bemoan and suffer from a new dynamic such as the rise of passive investing and ETFs, or ride that trend.
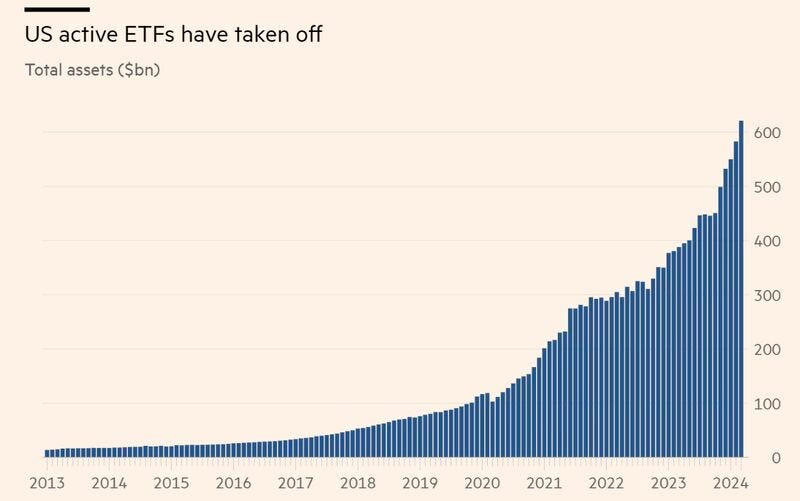
Source: mahmood noorani
10. Buffetology: Got to include an oldie but a goodie since it’s Berkshire weekend — Warren Buffet’s net worth. The thing that this always reminds me or stands out to me is how he didn’t reach billions until his 50’s, and things only really accelerated in his 60’s. Power of compounding and a counter to the get-rich-quick-young crowd.
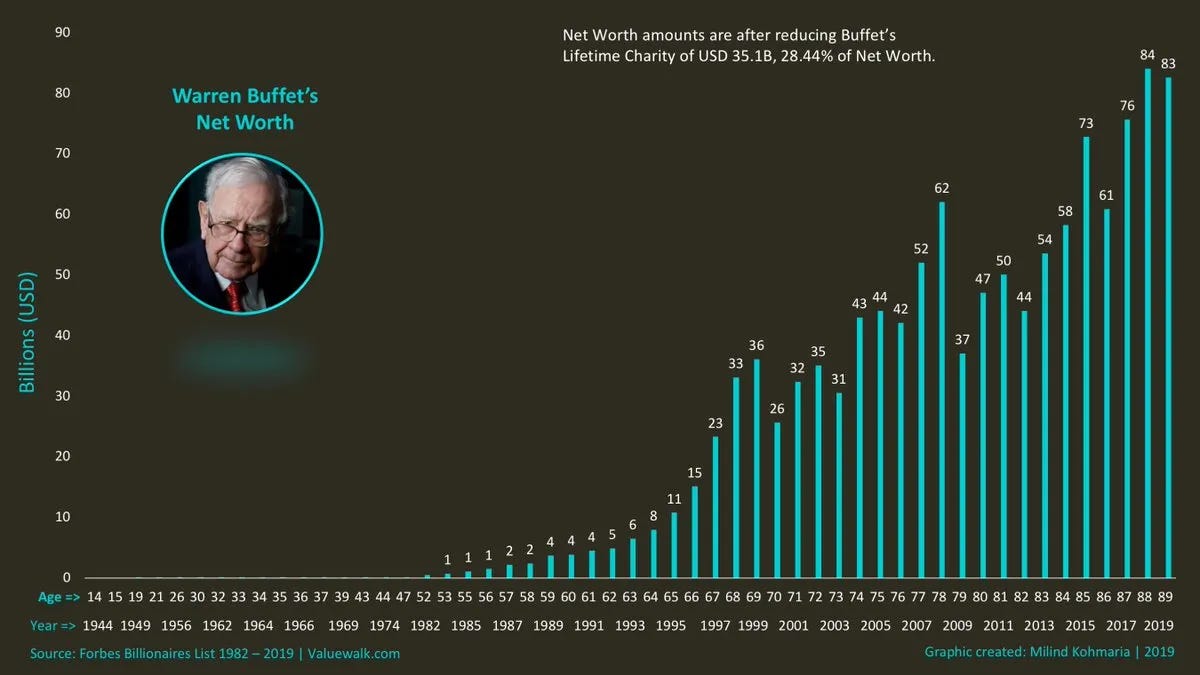
Source: Weekly S&P500 ChartStorm - 21 November 2021
REMINDER — Action items :-)
Follow
andSign up to the (free) Chart Of The Week at
Check out MarketCharts charting tools
Take advantage of the Weekly ChartStorm special rates
BONUS CHART SECTION… Chart + mini-blog on Tracking Effective Interest Rate trends in Global Equities (upgrade to paid to access)
Paid Subscriber Benefits:
Access to the Bonus Chart section (exclusive chart/theme/insight)
Access/Participation in the Comments Section (paid subscribers only)
Have your Questions Answered (by email or in the comments)
Quick+Responsive Customer Service (no issues unresolved)
Ad-free (no ads in the way, no marketing emails)
Upgrade to paid for instant access to these benefits and gain a greater level of insight, join a community of intelligent investors, and support the cause
Thanks and best regards,
Callum Thomas
Founder & Editor of The Weekly ChartStorm
Twitter: https://twitter.com/Callum_Thomas
LinkedIn: https://www.linkedin.com/in/callum-thomas-4990063/