
Weekly S&P500 ChartStorm - 5 February 2023
This week: monthly chart updated, bullish statistical patterns, positioning, liquidity, recession patterns, fair value, Fed pivot plays, earnings outlook, the unwind, and sentiment vs allocations...

Welcome to the Weekly S&P500 #ChartStorm — a selection of 10 charts which I hand pick from around the web and post exclusively on Substack.
These charts focus on the S&P500 (US equities), and the forces and factors that influence the outlook - with the aim of bringing insight and perspective.
For more background, see: ChartStorm Origin Story
1. Happy New Month! Welcome to February (what some might say is the *actual* start of the year, given all the disruption and chaos and out of office replies you get during January). Along with the breakout of that widely-watched trendline + initial break out vs resistance (4100) + a golden cross… January’s 6.2% gain for the S&P500 saw it retaking its 10-month moving average.

Source: Topdown Charts @TopdownCharts
2. Big Up January: And historically, when you see such a strong January after a down year, the historical tendency (albeit small sample size) has been for the full-year return to be positive and meaningfully so.
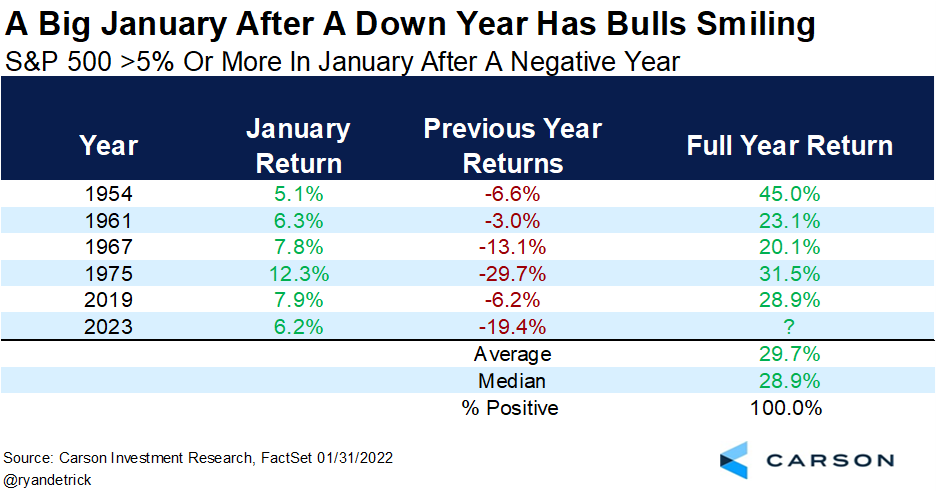
Source: @RyanDetrick
3. Hedge Fund Positioning: Similar to what we looked at in the bonus chart section from last week (institutional investor positioning and bullish speculation in leveraged funds) — here’s another data point showing the still significant skepticism on equities. This skepticism may be well justified (I think so), but equally — these guys may end up being 100% correct in the bearish prognosis… but meanwhile end up dragged kicking and screaming into increasing exposure/reducing shorts as the market rips higher and minds get changed/forcibly risk-managed.
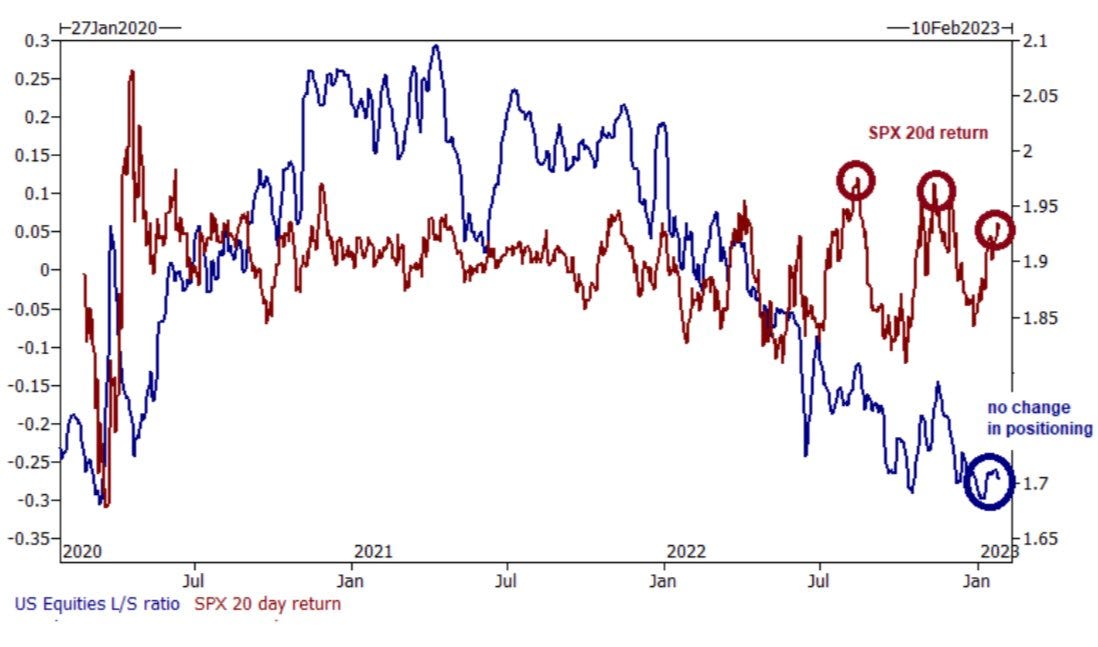
Source: @WifeyAlpha
4. Central Bank Liquidity: This is a particularly intriguing chart in the context of what we’ve looked at so far this session — while central banks continue to hike rates and overall settings are still tight, the rate of change in global central bank liquidity no longer seems to be the headwind that it was in 2022. The key drivers in this shift are the PBOC + BOJ… Asia to the rescue?

Source: @steve_donze
5. Recession Trading: Despite some volatility, the overall trend in economic data has been downwards and all the leading indicators I look at point to recession… but has this already been priced-in?
(n.b. a quick glance at the data; looks like US industrial production peaked in September last year vs the market peaking in January 2022 — if the current rally is sustained (and October turns out to be the bottom), based on the chart below that would imply a trough in the economics about April… which would imply a very brief short/sharp recession….)
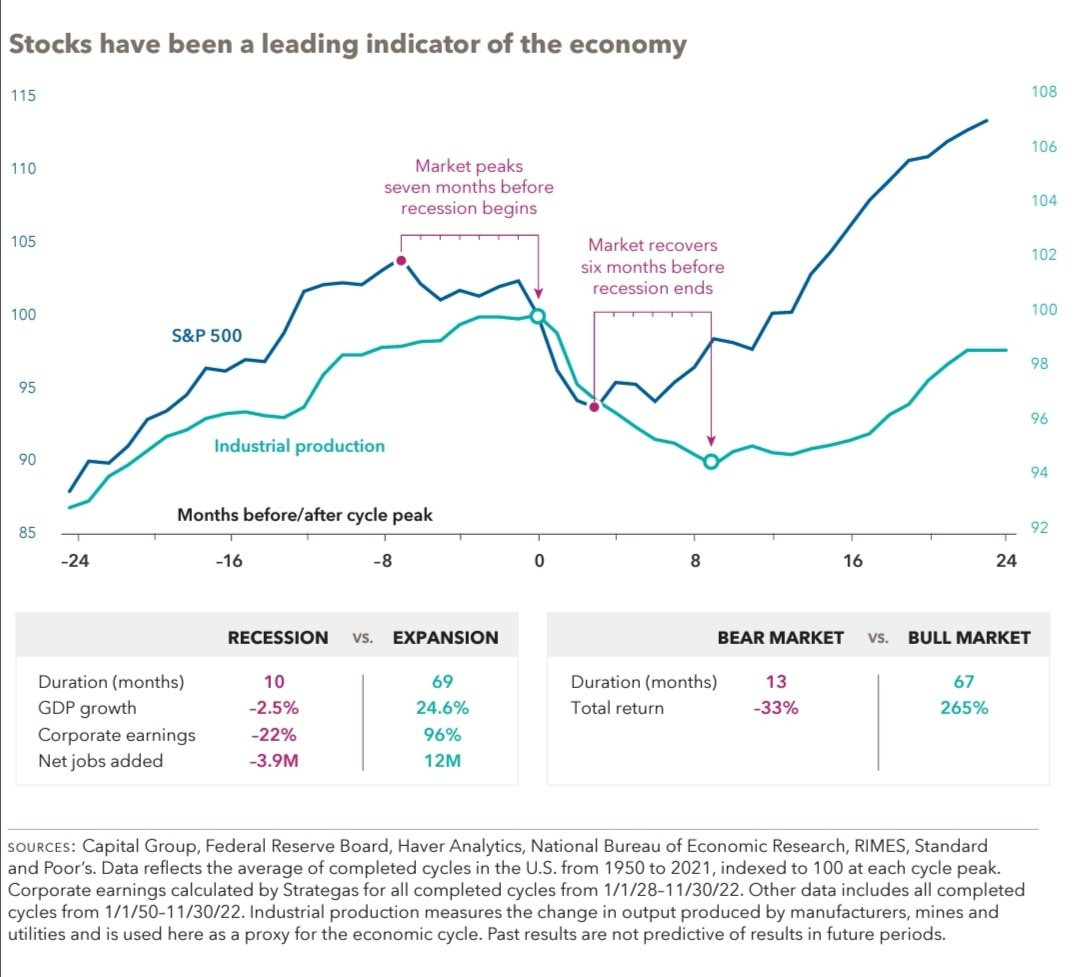
Source: @ssinvestments8
6. Fair Value? According to Morningstar’s fair value tracker (which aggregates the over/under valuation estimates from all the individual stocks they cover), the market is “cheap”, and has been cheap since most of last year. This is a contrasting picture to just above every other valuation metric I follow.

Source: Market Fair Value
7. Fed Pivot and the Stock Market: But is it really all that simple?
