

Welcome to the latest Weekly S&P500 #ChartStorm!
Learnings and conclusions from this week’s charts:
The S&P500 remains in a healthy uptrend.
(but the equal-weighted S&P500 has seen a major correction)
The key driver of pain in the SPXEW is rising rates.
The Equity Risk Premium has fallen to generational lows.
Small Caps seeing heavily crowded shorts (short squeeze potential?)
Overall, the overarching trend remains up for stocks, but rising rates have inflicted severe pain on rate sensitive sectors. Continue to monitor downside risks for stocks as the cycle progresses, but also upside risk in small caps + other sectors…
ICYMI: [Video] The Topdown Charts Approach to Generating Winning Investment Ideas (seminar on investment process) [Click Here]
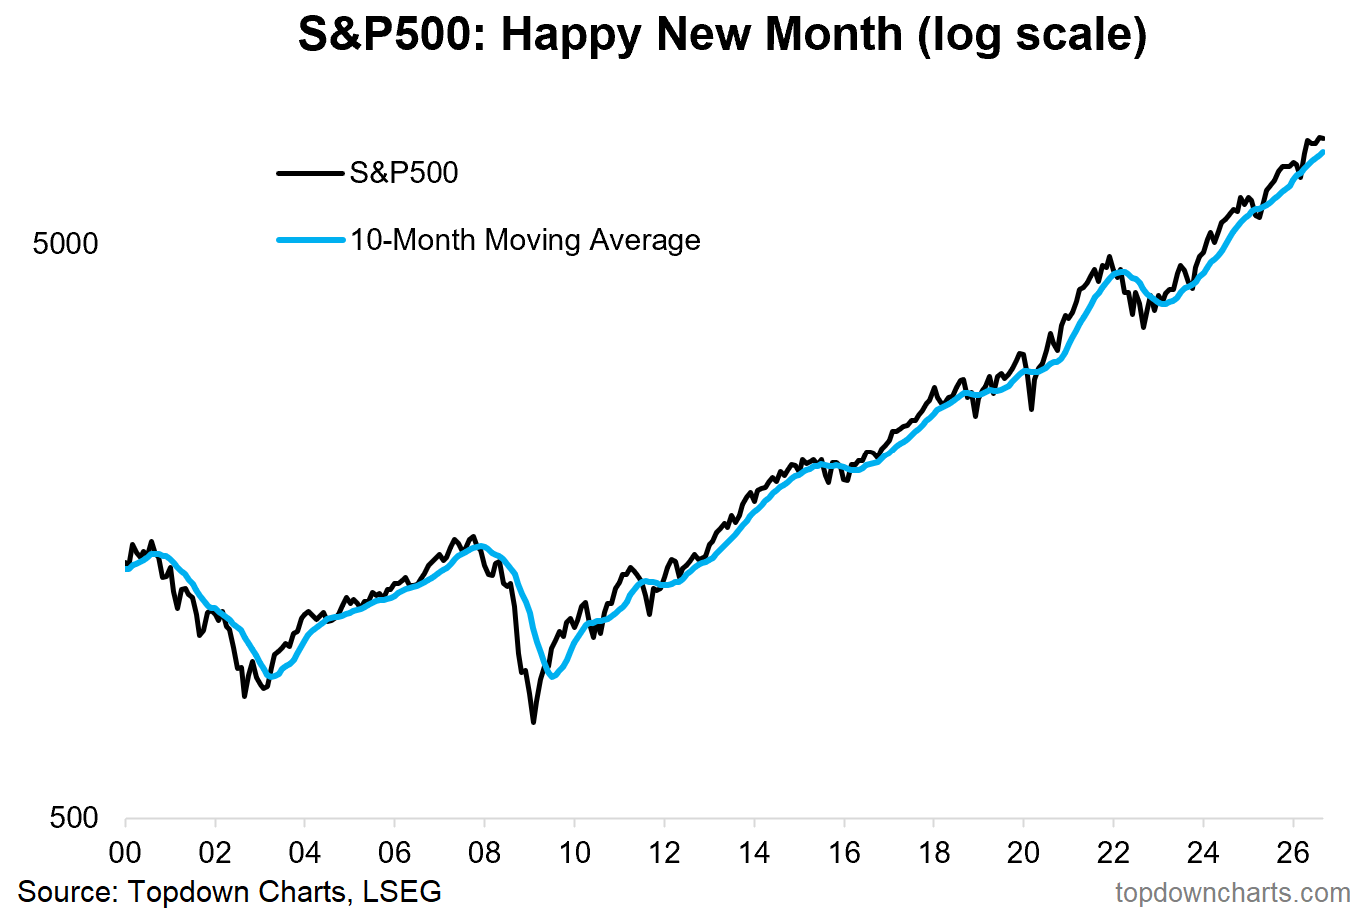
1. Happy New Month! The S&P500 closed September down slightly (-0.5% m/m), but is still up +11.8% YTD (+12.8% including dividends). Zooming out, the index remains above its 10-month moving average and is clearly still in a strong uptrend (this is what a bull market looks like).
Source: Topdown Charts Professional
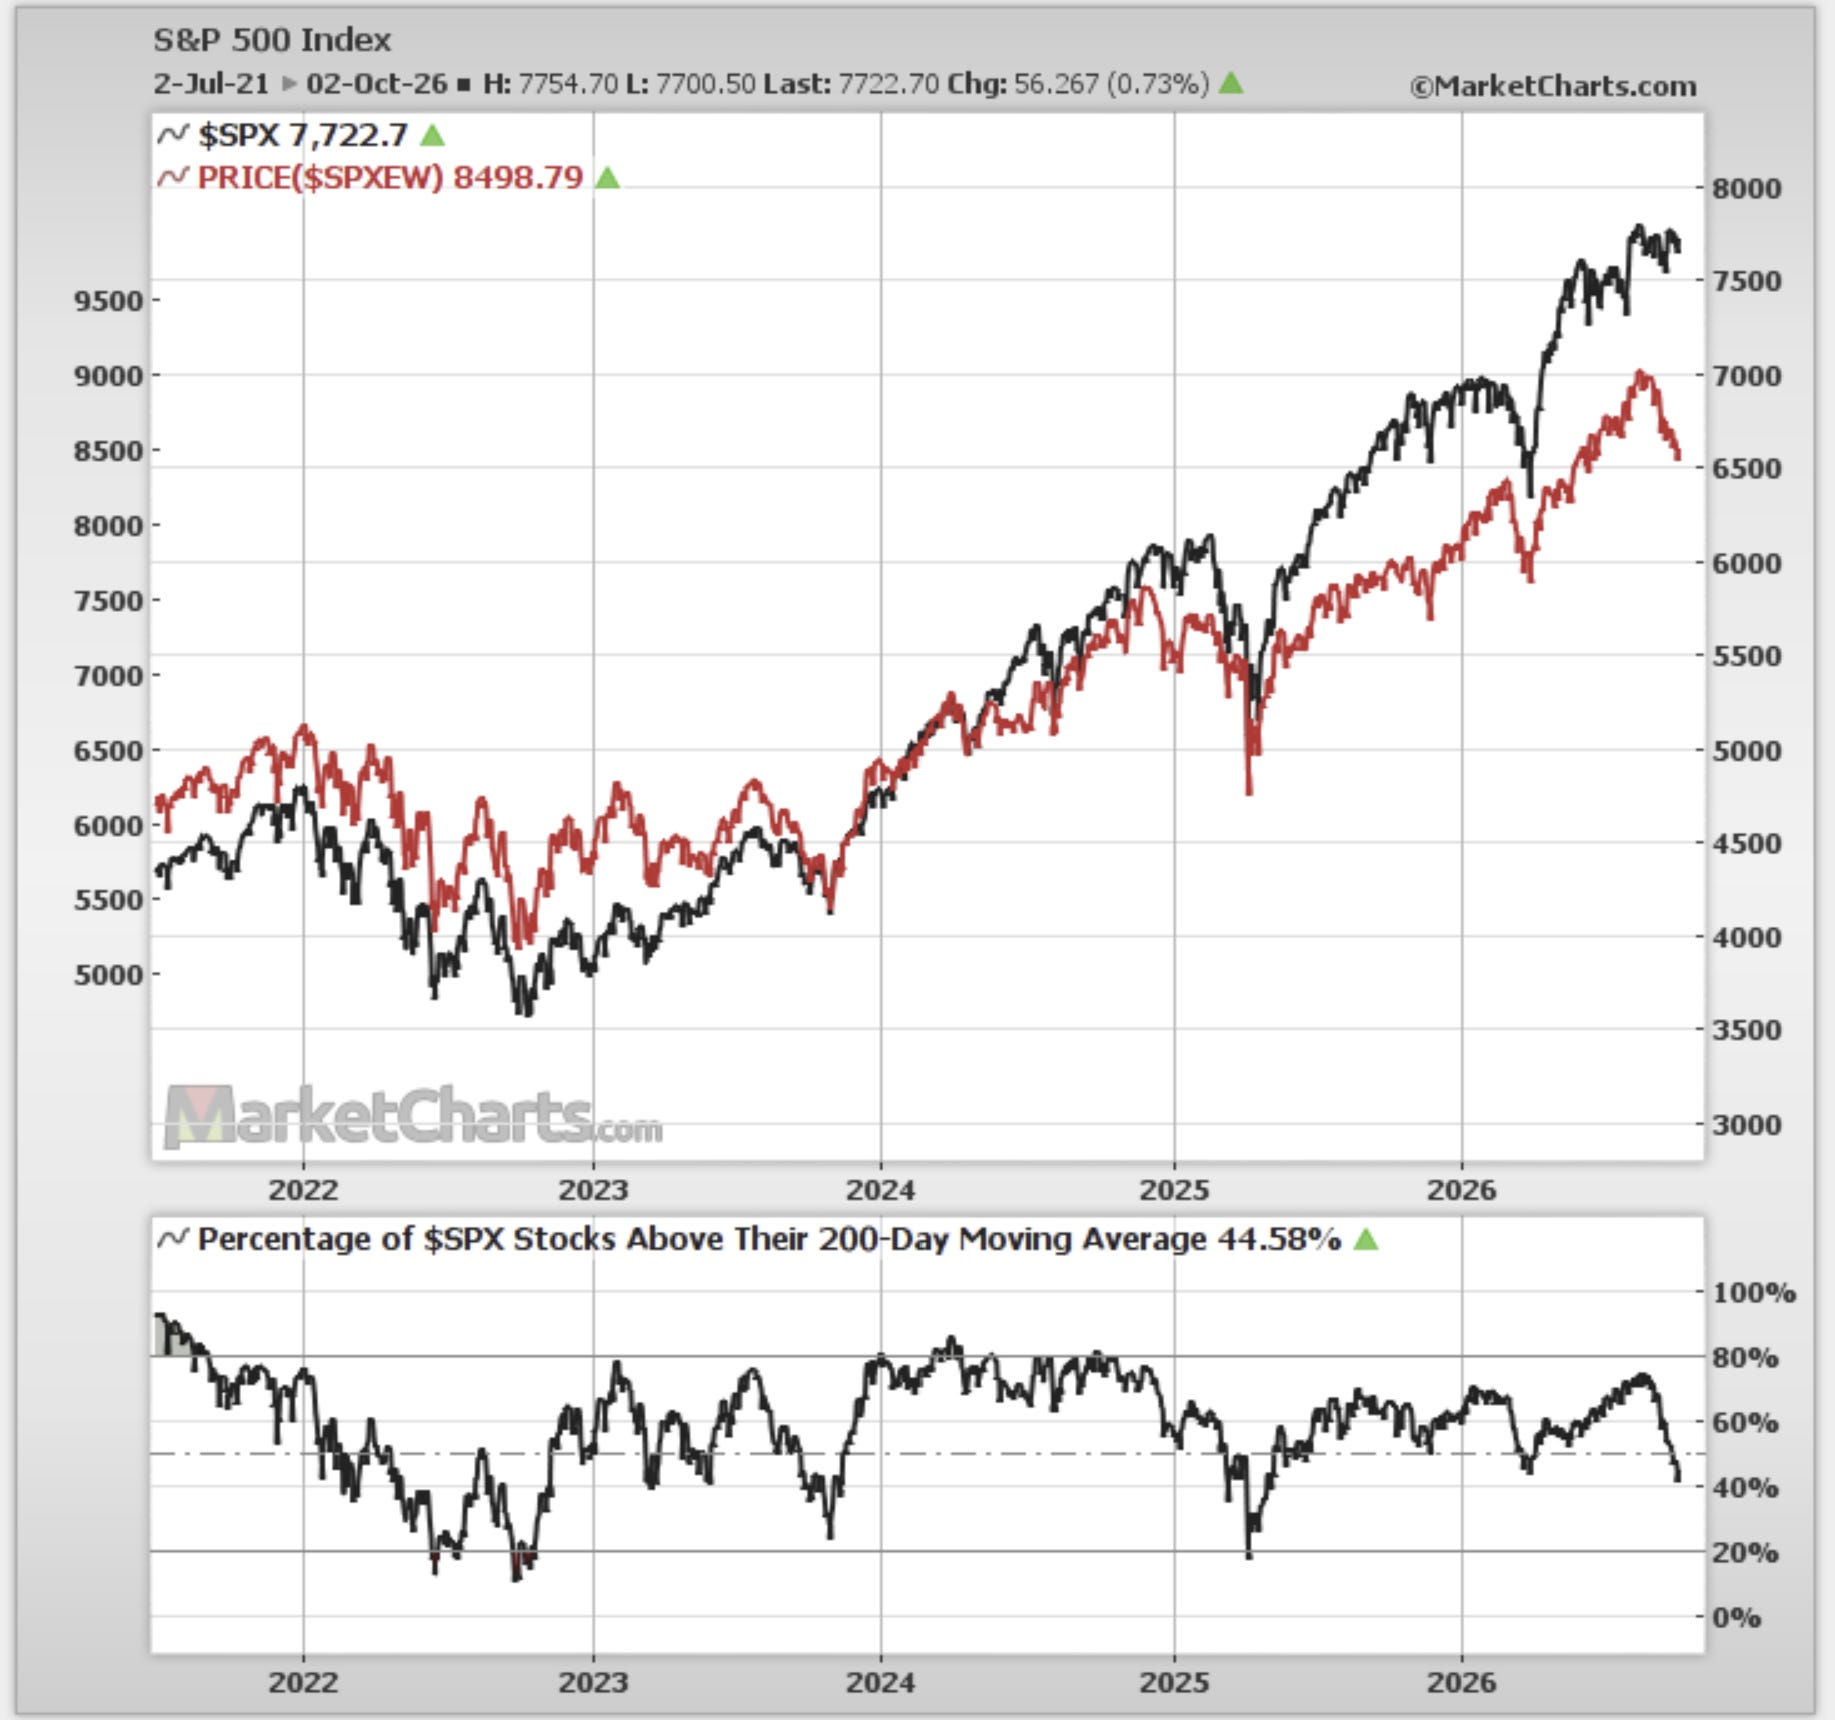
2. Equal-Weighted Weighed-Down: however, the equal-weighted S&P500 closed September down -5% m/m, and has seen an almost -7% drawdown off the mid-Aug peak. Breadth has also plunged to the worst levels since the 2025 tariff-tantrum. And there is a very clear reason for this…
Source: MarketCharts.com
3. It’s a Rates Thing: rate-sensitive sectors have been clobbered —declining an average -10% thanks to the Fed pivot to rate hikes + global sovereign bond bust.
