Weekly S&P500 ChartStorm - 4 June 2023
This week: monthly charts, performance breakdowns, breadth, tech flows, FANG+ valuations, volatility risks, recession relegation, savings, and sentiment shifts...
Welcome to the latest Weekly S&P500 #ChartStorm!
Learnings and conclusions from this week’s charts:
The S&P500 has traded above its 10-month moving average for the 5th month in a row, with most of its strength driven by large cap growth/tech stocks.
The equal-weighted S&P500 has lagged the cap-weighted index by about 10% YTD, as the “market“ divides into winners (tech) and losers.
Record inflows into tech stocks have driven rapid valuation re-rating.
Recession risk remains a key downside risk for markets, as well as complacent equity market volatility vs elevated bond market volatility.
The mood among investors is clearly turning up, and flows + FOMO could take the market higher despite the risks given low starting point levels of exposure, positioning, and sentiment.
Overall, the growing froth and fervor in tech stocks may well override macro concerns in the immediate term, as bullish headline technicals invoke a visceral fear of getting left behind for both retail and institutional investors. In that type of environment the bar is high for new bad news to scuttle self-reinforcing sentiment streams.
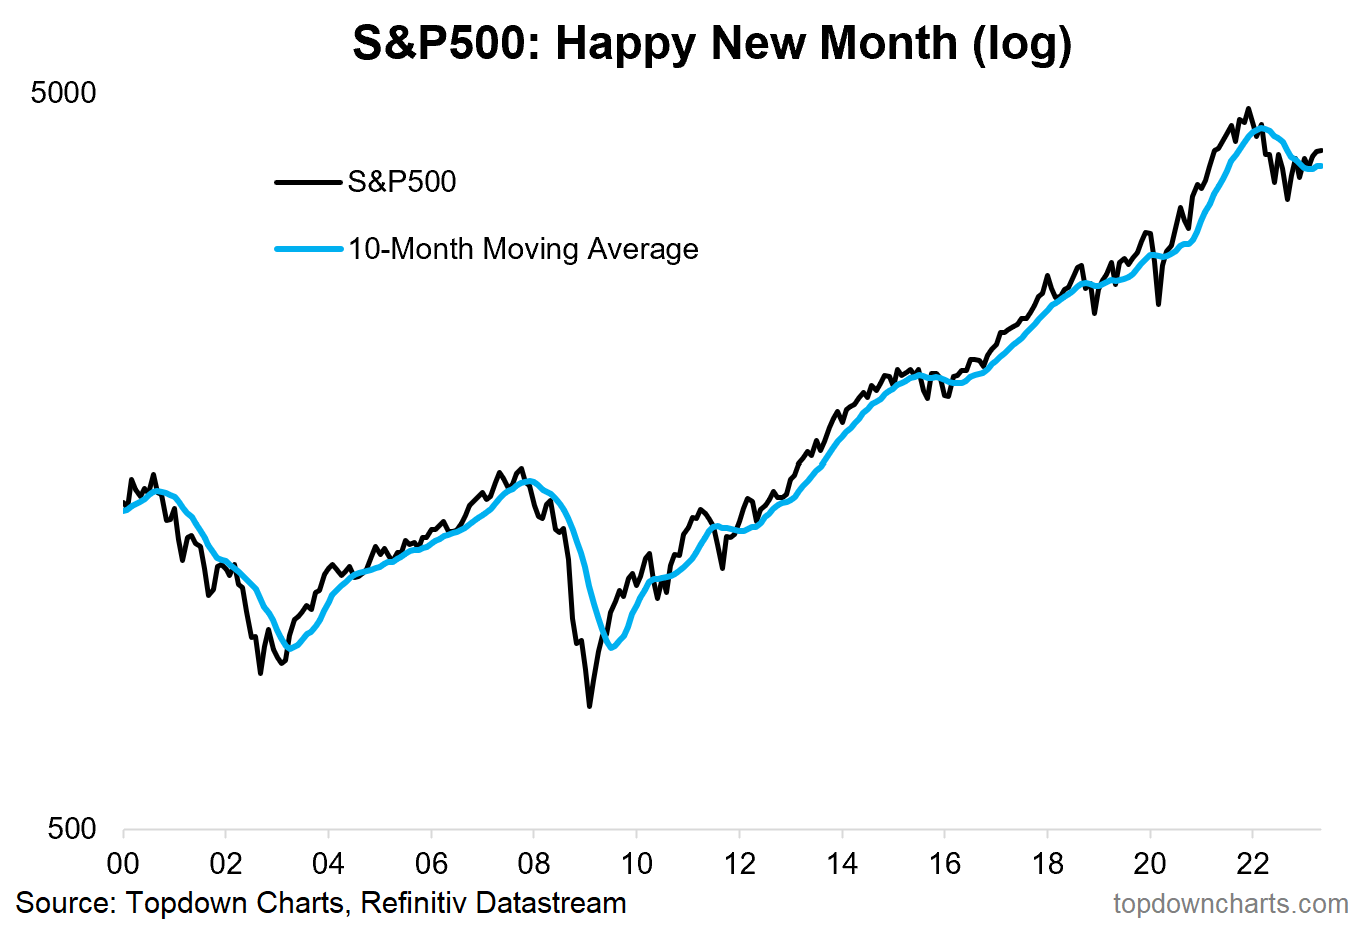
1. Happy New Month! May marked the 5th consecutive month in a row that the S&P500 finds itself above its 10-month moving average (which is basically the ~200 day average — and essentially a dumb rule for figuring out if the market is in an up or down trend). If you didn’t know anything else and only had this chart you’d probably be bullish.
Source: @topdowncharts Topdown Charts
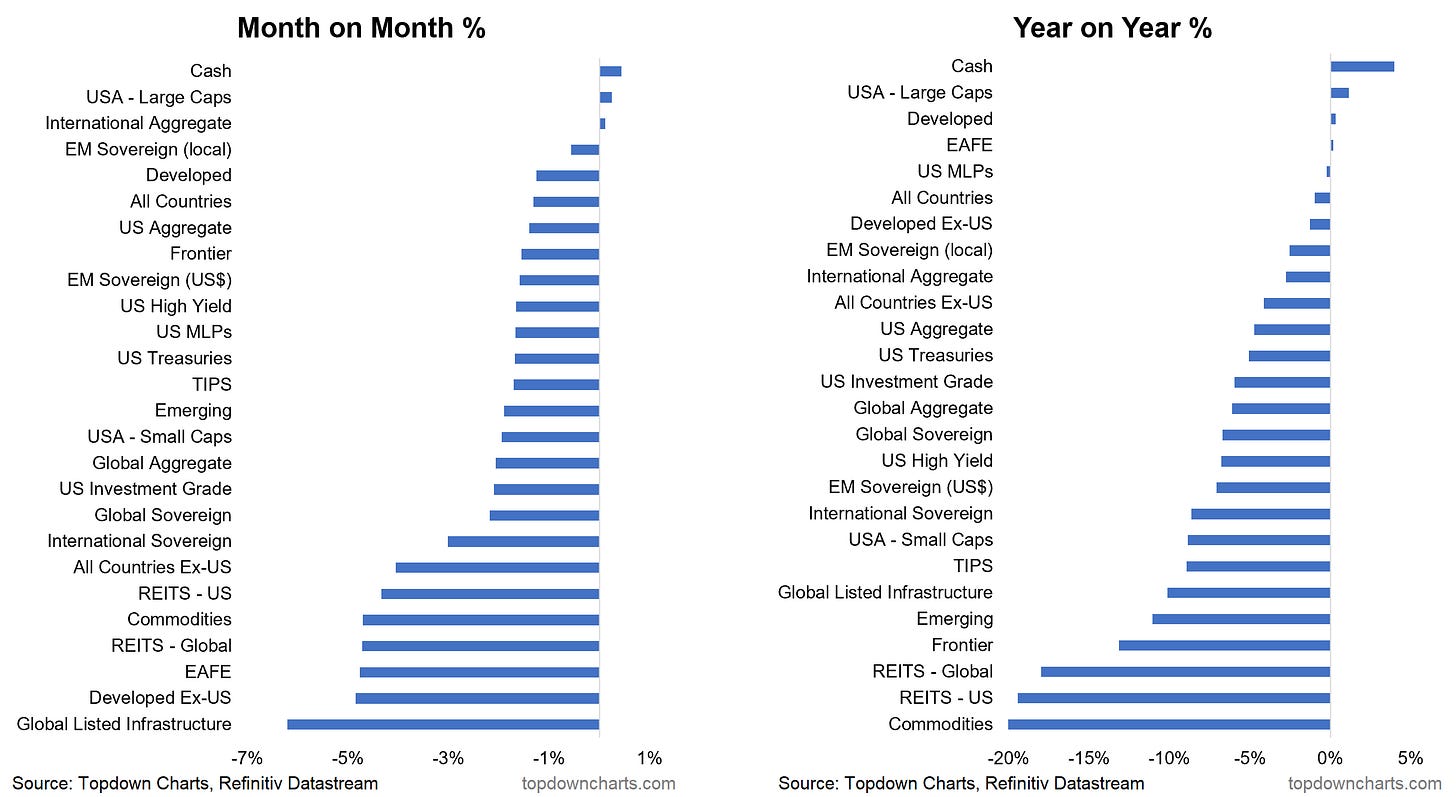
2. Asset Class Performance Tables: May also saw the S&P500 among the only major asset classes turning in positive performance on the month (and on the year). Aside from US large caps, cash was the only other solid performer — rare situation indeed that you can make that kind of statement!
Source: Asset Class Returns
3. Flavors of US Equities: Within the various style/factor flavors of US equities, there is basically one segment of the “““market“““ doing all of the heavy lifting (n.b. this is excess return, hence why the S&P500 is 0%). Notably, the equal-weighted S&P500 has underperformed by about 10% YTD.
Source: @lhamtil
4. Performance Breadth: And yes, in case you are wondering, this is highly unusual.
Source: @Growth_Value_
5. Tech Flows: And what’s driving all this? A furious stampede into tech stocks…


