Weekly S&P500 ChartStorm - 30 October 2022
This week: market technicals, put option activity, bear market trading statistics, foreigner flows, valuations, energy cash, bearish greed...
Welcome to the Weekly S&P500 #ChartStorm — a selection of 10 charts which I hand pick from around the web and post on Twitter.
These charts focus on the S&P500 (US equities); and the various forces and factors that influence the outlook - with the aim of bringing insight and perspective.
Hope you enjoy!
This week’s edition is sponsored by Alts.co
Alts.co demystifies the world of unique investment ideas, such as Collectibles, Artwork, Farmland, Websites & more. Check it out — Subscribe now.
1. S&P 500 Battle Lines: Former support, now resistance.
Given previous chopping and twists and turns around this level, I would say it may take a couple of attempts to actually breakout — but if it can make a clean clear break above 3900 it will make bears very uncomfortable...
Source: @Callum_Thomas
2. When They’re Up They’re Up: Very interesting chart by Nomura, seeming to show that October had much more upside participation by individual stocks than usual... bullish repair work?
Source: @zerohedge via @dailychartbook
3. Small Trader put vs call Premium: In a bear market put options are more valuable than call options... especially when everyone wants 'em, and especially usually at the worst possible timing! (but good source of info for students of market psychology)
Source: @jaykaeppel
4. Short-Sighted Option Traders: Interesting follow-on, this one gives a glimpse at the timeframes in operation at the moment... heavier trading in extremely short-dated options. A sign of crash risk concern? or bearish greed? (or perhaps even just less confidence in the view either way, so no appetite to eat the time decay involved with holding longer-dated options)
Source: @SnippetFinance — see: Snippet.Finance
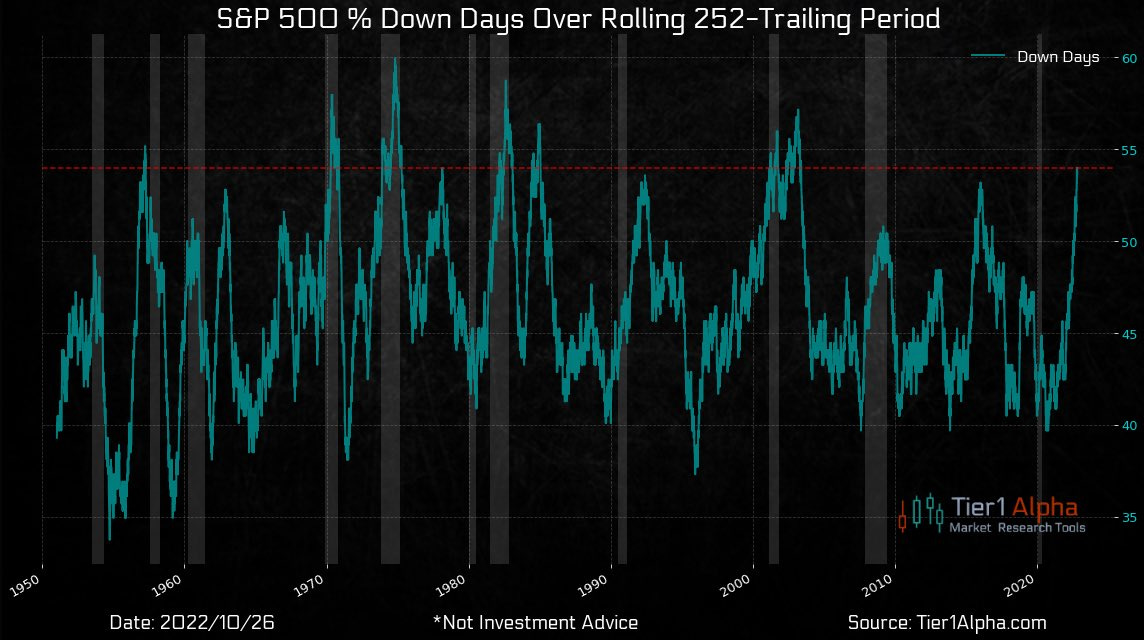
5. Bear Market Trading: Market just clocked-up the most down days in 20yrs — similar to the dot-com burst bear, and 1970’s inflation bears. One thought it prompts is a caution to those begging for a Fed pivot -- this is not a March 2020 crash situation where pivot = moon, this is a full blown recessionary/inflationary/overvaluationary bear market that’s just going to have to take time to run its course.
Source: @t1alpha via @DiMartinoBooth
6. Bear Season: Seasonality works different in a bear market.
Interestingly, it seems like you do historically get a pre-Mid-Term rally during bear markets, only for disappointment to drift the market lower into year-end... probably fits the script this year given all the pre-election jawboning that’s been going on.
Source: Chart of the Week - Bear Market Seasonality
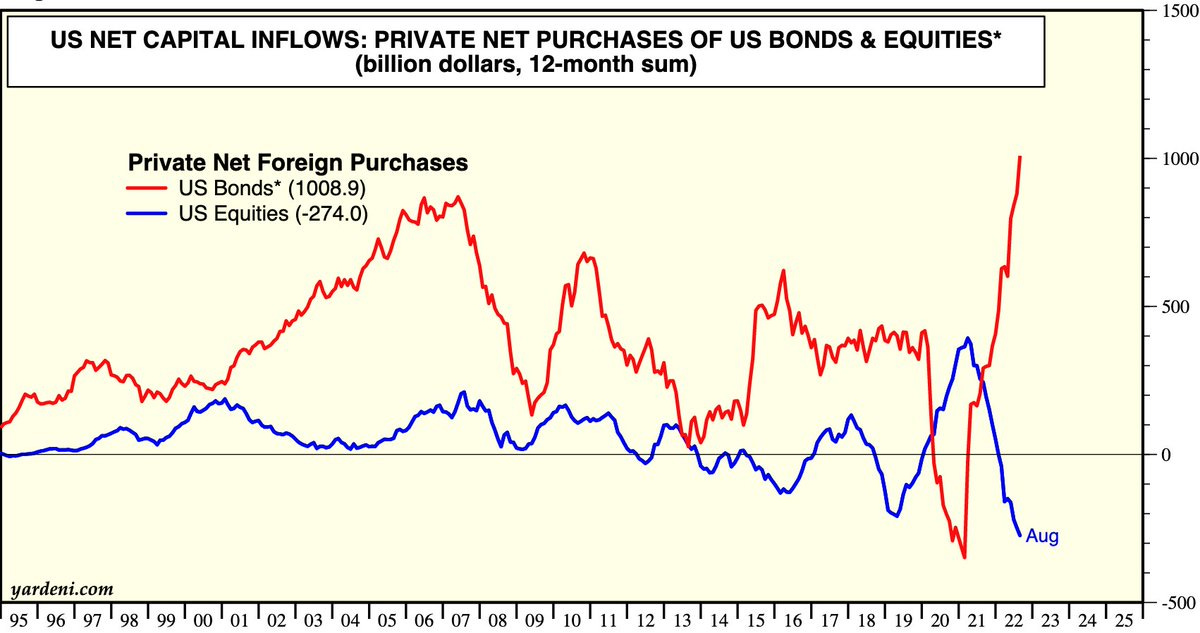
7. Foreign Flows: Interesting to see foreigners selling equities but buying bonds. Both have done miserably this year. As a guess I would say the equity line is an active decision, the red line is probably forced buying. It also speaks to the solid relative performance of US v global bonds (esp. in US$ terms!), and lack of appetite for EM bonds or anything in or close to Europe.
Source: @Mayhem4Markets
8. Valuations: Good news everyone — the 5 largest stocks of the S&P 500 have seen their valuations reset to a “Permanently High Plateau” (thanks to Irving Fisher for that borrowed-term coined in 1929). On a slightly more serious note, we could argue that the “S&P495” is now looking cheap, but n.b. this is based on consensus EPS (which likely fall in recession).
Source: @zerohedge
9. Big Value in Small Caps? The S&P 600 PE10 ratio (price vs trailing 10yr average earnings) is sitting about 10% below the average of the past 25 years, and is trading at a discount of -10% vs the S&P 100 (which compares to an long-term average premium of +5%). So I would say yes there is value in small caps, but probably better described as small value in small caps (which is at least 40% better than where it was!).
Source: Chart of the Week - Small Cap Valuations
10. Energy Cash: Energy companies are finding it too hard + too risky to invest in capex, so the best bet in their book is to just return those energy-shock cash-windfalls to investors.
Good for shareholders.
Maybe not so good for consumers — likely makes energy transition a bumpier road (still need a lot of oil and gas even if you do eventually get to carbon-zero).
Source: @WallStJesus
SPONSOR — please take a moment to support us by checking out our sponsor…
Discover and invest in the best alternative assets
Baseball cards, collectibles, NFTs?! There’s a whole world of alternative assets out there, but how do we value them? Enter a newsletter literally called Alts, navigating us all through investment options that don’t get as much attention.
Every week, their team dives into a different asset, with past issues ranging from assets like racehorses to watches to billboards. The team promises:
To analyze unique deals so you don’t have to
Honest research and rich insights to break through all the noise
Trusted and unbiased recommendations to help deliver returns
Alternative Assets is unveiling powerful ways to grow your money every week, so it’s no surprise that over 50,000+ investors read it. Subscribe to see for yourself.
BONUS CHART >> got to include a goody for the goodies who subscribed.
Be Greedy When Betting on Others’ Fearfulness? We’ve seen a steady lift in trading activity in inverse equity ETFs as traders look to turn a quick buck betting on bear.
The chart shows aggregated trading activity in inverse/short equity ETFs which seek to benefit from declines in stock prices. Aside from the general uptrend in trading action across these ETFs this year, we can see clear spikes and climaxes around short-term market bottoms.
So it is an interesting indicator in terms of gauging investor sentiment/psychology, both in terms of how the crowd seem to be bandwagoning into the bear bets, but also in terms of how the spikes in this indicator carry contrarian information.
But it reminds me one of the old wisdoms of the market — that it tends to deal out the maximum amount of pain and confusion to the maximums number of participants. And with speculators getting greedier on fear by betting on bear, maybe a rally is needed to scare or scar the greedily bearish (and perhaps only to then turnaround and fool the fearfully bullish).
Be skeptical when others are greedy and fearful.
—
Best regards,
Callum Thomas
My research firm, Topdown Charts, has a NEW entry-level service, which is designed to distill some of the ideas/themes/charts from the institutional research service to provide the same high quality insights at a more accessible price.
Give it a try and let me know what you think! :-)
For more details on the service check out this recent post which highlights: What you get with the service; Performance of the service; and importantly: What our clients say about it…


#10 chart was very interesting and the Bonus Chart also got my attention along with your comments. Thanks!
Much better seasonal graph than last weeks. Cheers