Weekly S&P500 ChartStorm - 30 July 2023
This week: valuations, risk indicators, non-recession bears, recession risk, sales outlook, extreme weather stocks, fund manager success rates, shortage of stocks, old vs new economy capex trends...
Welcome to the latest Weekly S&P500 #ChartStorm!
Learnings and conclusions from this week’s charts:
US equity valuations are expensive vs history and vs bonds.
Risk indicators are lighting up e.g. speculative call option buying.
The 2022 bear market was in hindsight a “non-recessionary bear”, and bears all the statistical hallmarks of that species of bear.
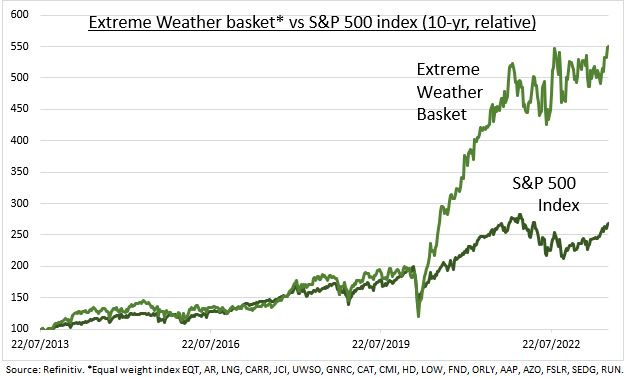
A basket of “extreme weather stocks” has been notably outperforming.
The number of publicly traded companies across developed markets has been cut in half over the past 20-years (leading to a shortage of stocks?).
Overall, thinking about the risk outlook, valuations are marching further into expensive territory, Fed policy consensus seems to be higher for longer, seasonality is turning negative, sentiment is crowding to the bull side, and risk indicators are starting to light up. Maybe it isn’t a sign of a near-term peak, but it’s at least easy to say it’s riskier to be a blind bull in that backdrop.
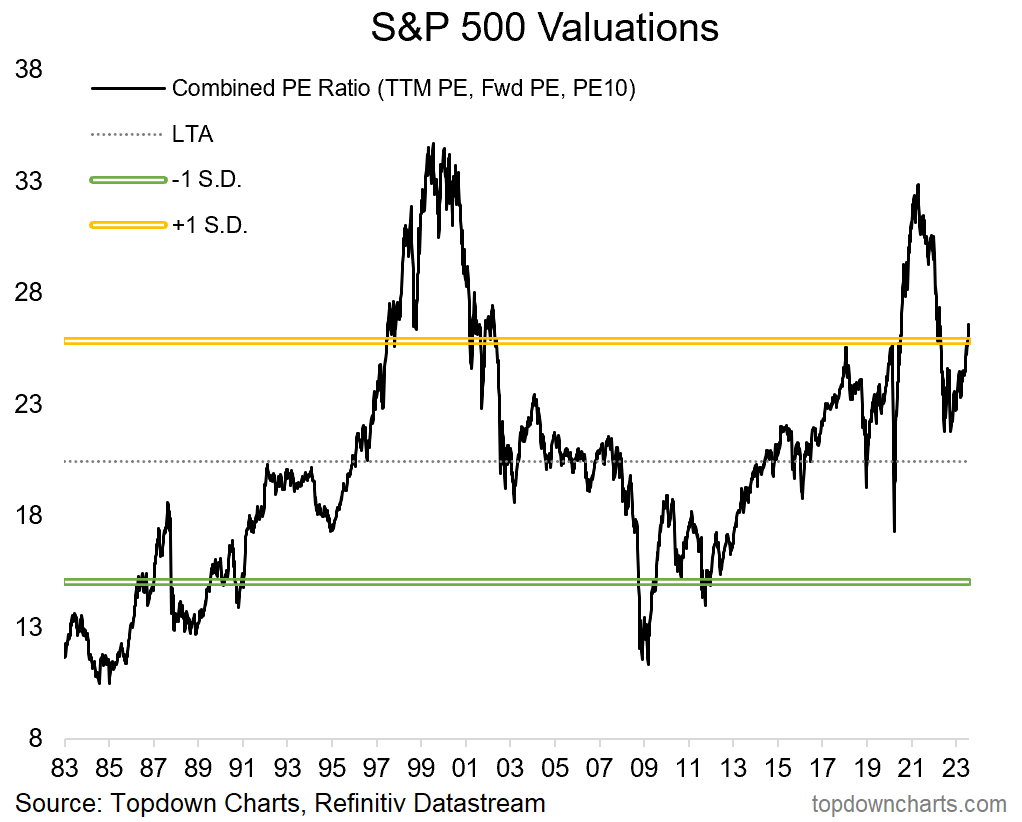
1. Valuations: Starting this week off with a quick update on valuations — the S&P 500 combined PE ratio (which is an average of the trailing PE, forward PE, and CAPE: designed to emphasize signal vs noise) has broken out to a 16-month high; topping the peaks in 2018 and early-2020; pushing up above the 1-Standard Deviation band around Long-Term Average (“expensive“) …and yet still materially below the dot com bubble peak and the pandemic liquidity frenzy peak.
It sort of begs an open question of “breakout or barrier?“ — the bulls will tell you either that valuations simply don’t matter, or that this is a breakout on the way back to the highs, and the bears will say that every inch higher in valuations from here increases the risk of lower (negative) forward looking returns. I think they can both be right in a way, and it’s a complex topic, but one thing we can all agree on (maybe!) ———> it ain’t cheap.
Source: Topdown Charts Topdown Charts Professional
2. Earnings Yield vs Bond Yield: The “yield“ on equities (i.e. of earnings — which of course can go up and down, and usually up over the long-term — vs price), is at the lowest premium since 2007 vs the yield on treasuries (which for completeness, and in simple terms, measures expected fixed interest payments vs the price of bonds). In other words, relative to recent years, stocks look expensive vs bonds. So not only do stocks look expensive vs history, but also expensive vs less-risky alternatives.
Source: @SoberLook — subscribe to Daily Shot Brief for [free] daily updates
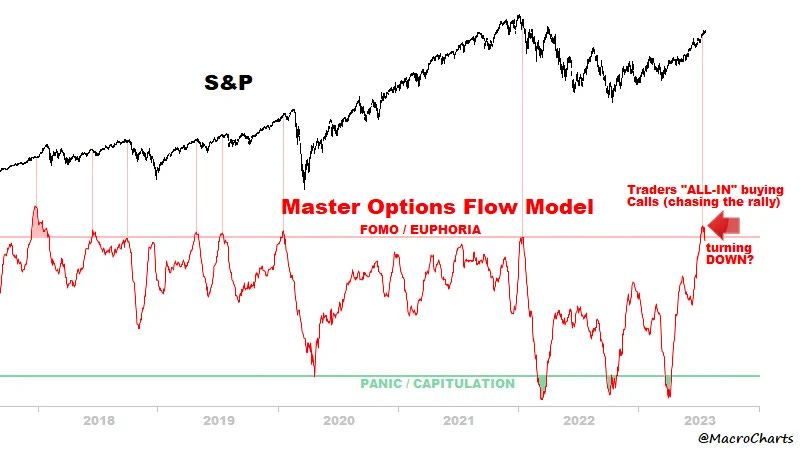
3. All-In: Traders are frantically chasing the rally via the more speculative call option instruments. This indicator seems to have a fairly reliable track record of flagging short-term peaks in the market. Certainly, as a minimum, when the indicator is at these levels the risk of downside is elevated. So along with negative seasonality and expensive valuations, the market risk outlook is not good.
Source: @MacroCharts
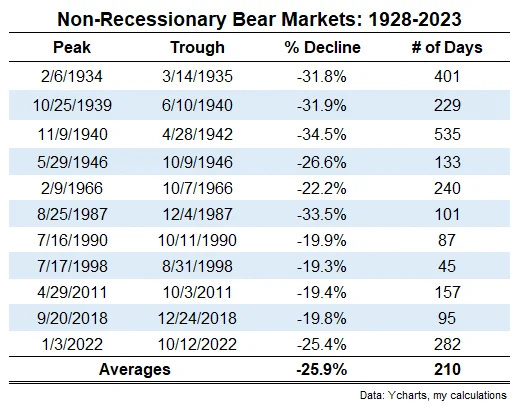
4. Non-Recessionary Bear Markets: By now it is fairly clear that the bear market of 2022 is been and gone. And in hindsight it turns out that it was what is termed a “non-recessionary bear market“ — the below table provides some historical context on how these typically look, and it sort of lines up with that species of bear. Of course it should be said that this does not preclude the possibility of a recessionary bear emerging in the near future.
Source: @awealthofcs
5. Stronger For Longer Until: Following on from the point that a recessionary bear could and probably will happen at some point, I’ll defer to Kantro’s quip: “Recessions surprise investors every time. It always looks like a soft landing, until it doesn’t, and that’s when minds are changed.”
Source: @MichaelKantro
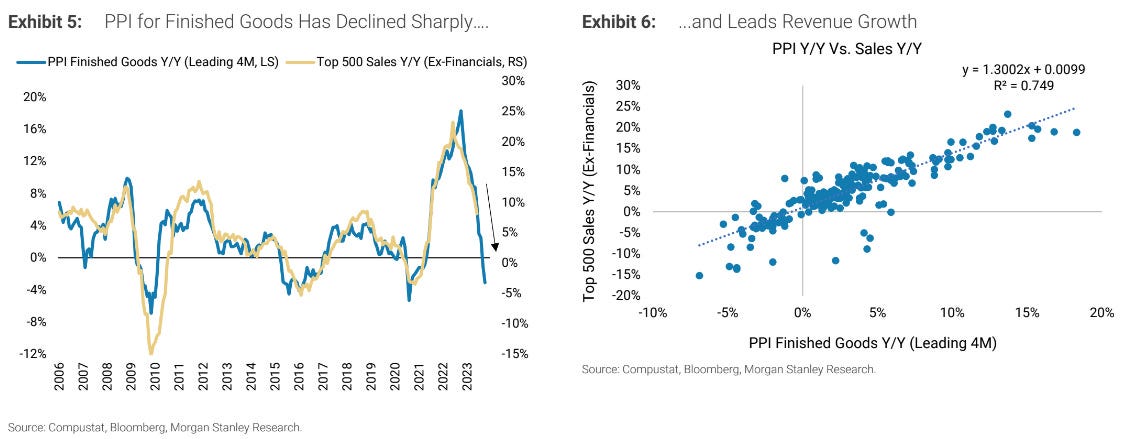
6. Nominal Growth = Sales Growth: One of the things holding up earnings has been the surge in nominal growth. Economists like to measure economic growth in real terms (i.e. removing inflation effects, to see what the real underlying growth in volumes is), but corporations don’t generate inflation adjusted sales — they are inflation… if companies raise prices and people still buy, that looks like inflation, but from a company’s standpoint that’s higher sales, and from an economic data standpoint that’s higher nominal GDP growth, regardless of what the “real GDP“ looks like. Anyway, US PPI is now in deflation on a YoY basis, and historically that has been consistent with deflation in sales.
Source: Daily Chartbook
7. Weather Basket Heating Up: The “extreme weather basket“ of stocks (“a simple-weighted basket of six stock segments seen as beneficiaries of extreme hot or cold weather”) has handily outperformed the S&P500. Regardless of your view on the reason or what if anything is to be done about it, weather extremes have clearly been on the rise with 2023 chalking up a bunch of new records. Here’s a way to both track and perhaps even profit from it in the markets!
Source: All-weather extreme climate stocks
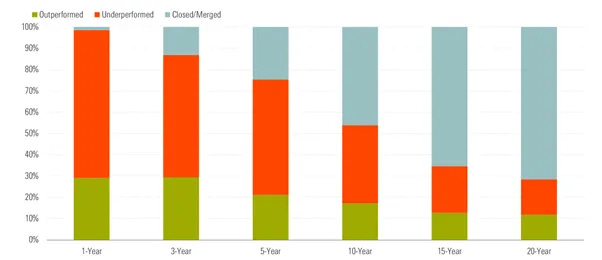
8. So You Want to Start a Fund? This chart provides an insight into the success rate of investment funds. The interesting takeaway is that over the long-run the historical probability of an investment fund even still being around is a little less than 30% (most funds either end up closing or getting merged into other funds (basically failing either due to bad performance or business reasons e.g. not enough AUM, and/or most likely both). Interestingly though, if your fund can survive for at least 20 years the odds of outperforming rise closer to 50/50 (but of course copious amounts of survivorship bias there!). n.b. this is for European funds.
Source: If you want to be a fund manager, go to France Behind the Balance Sheet
9. Shortage of Stocks: Pretty interesting to see the decline in the number of publicly traded companies across developed markets (almost cut in half over the past 20 years).
Keep reading with a 7-day free trial
Subscribe to The Weekly ChartStorm to keep reading this post and get 7 days of free access to the full post archives.


