
Weekly S&P500 ChartStorm - 3 August 2025
This week: monthly chart, technical check, VIX and credit spreads seasonality, awful Augusts, tech funds milestone, tech weights, electricity breakout, defensives...

Welcome to the latest Weekly S&P500 #ChartStorm!
Learnings and conclusions from this week’s charts:
The S&P500 closed up +2.2% for July (+7.8% YTD).
(albeit it subsequently slipped -1.6% the first day of August).
Volatility and Credit Spreads are seeing a seasonal upturn.
Investors are skewing portfolios heavier and heavier into tech stocks.
US electricity demand has broken out to a new all-time high.
Overall, there does appear to be a shift in focus from rebound to risk as the recovery from the April low runs its course and seasonal headwinds begin to weigh. Short-term technicals look a bit tenuous, pressure points continue to build, but medium/longer-term trend indicators remain healthy. So let’s see what happens…
PODCAST: last week I joined Dave Keller on the Market Misbehavior Podcast to talk macro, markets, process/philosophy, and investment strategy (click to view/listen)
1. Happy New Month! The S&P 500 closed +2.2% higher in July, placing it up +7.8% YTD (or 8.6% in total return terms); and ahead of the equal-weighted S&P 500 index (+0.9% in July, 4.7% YTD; 5.8% total return). July marked the 3rd month back above the 10-month moving average. All-in-all, it looks like a market in an uptrend.
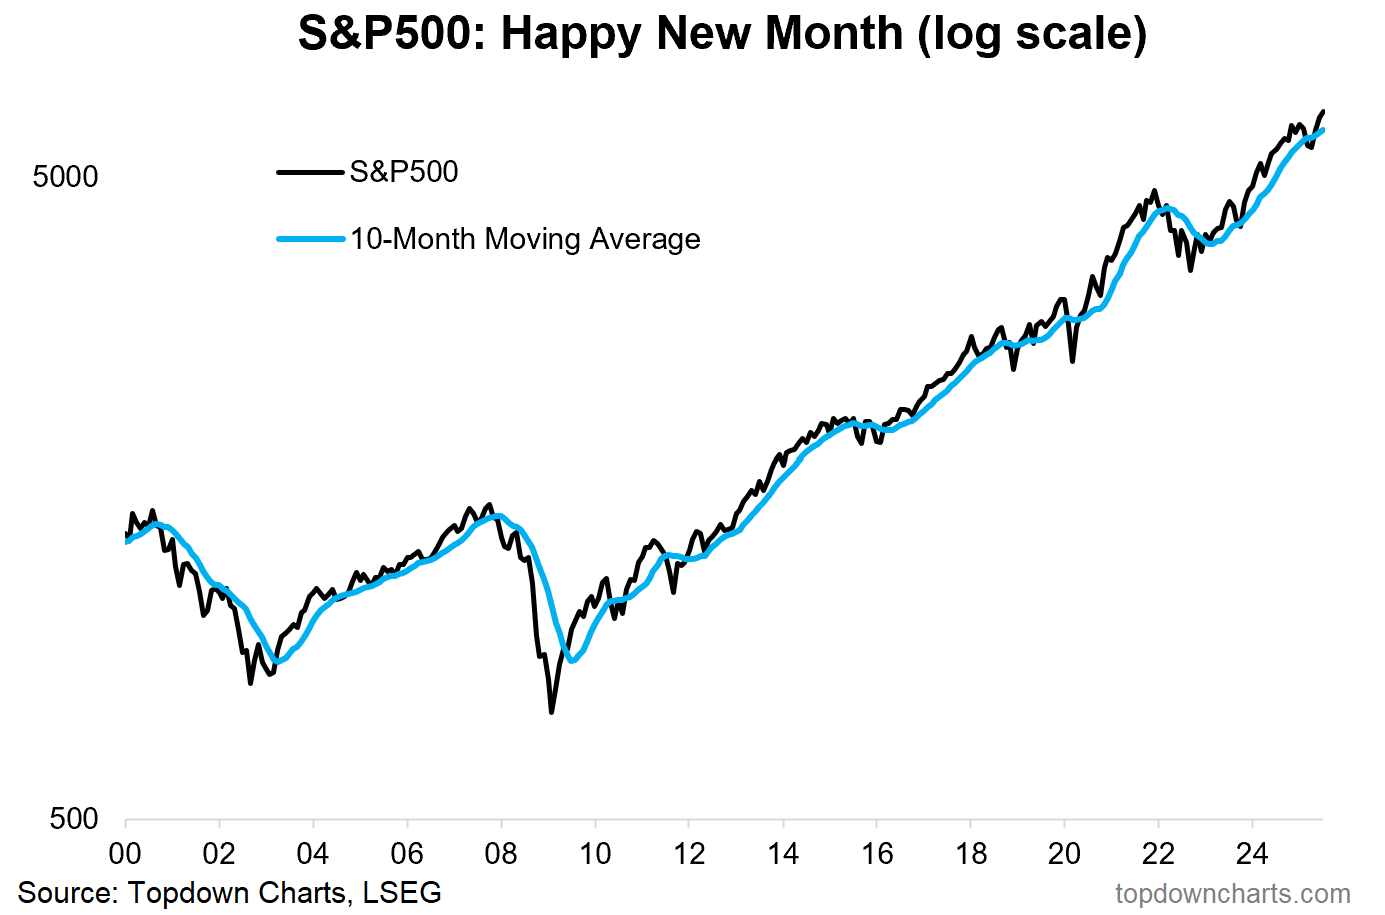
Source: Topdown Charts
2. Asset Returns Table: US large cap stocks managed 3rd place in the monthly returns table below, with Frontier Markets by far the standout. On the Year-To-Date stats, US large caps are about mid-table (global stocks still ahead as the great global rotation pushes on). Overall it was a risk-on month with stocks up and bonds down.
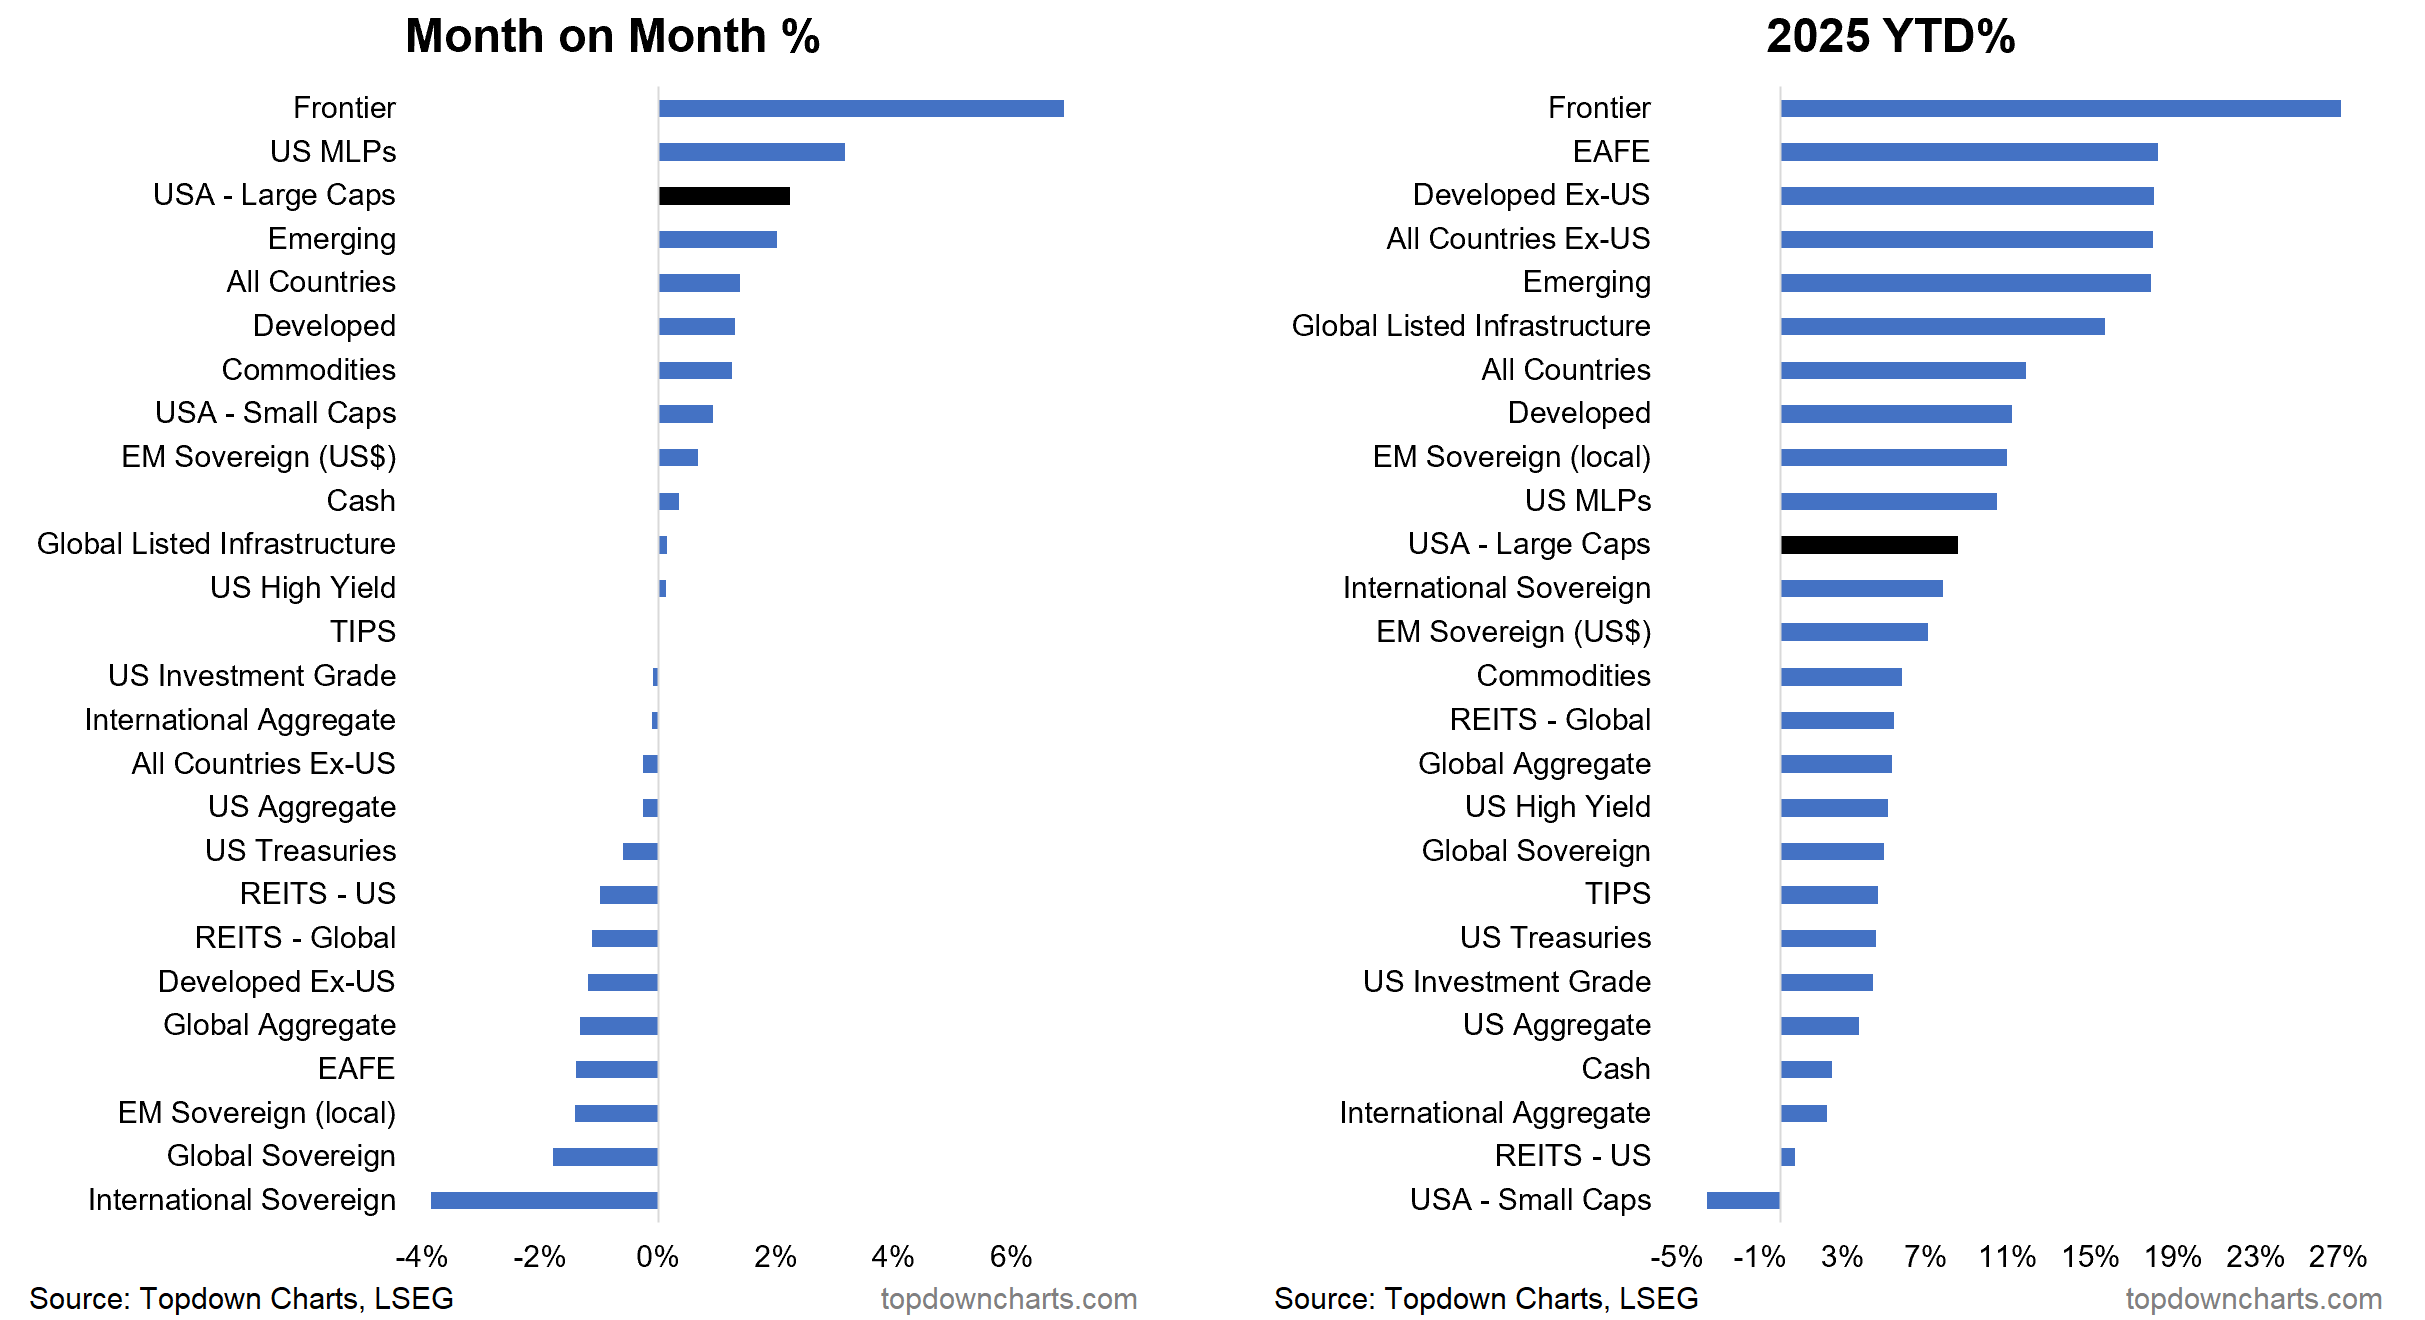
Source: Asset Class Returns - July 2025
3. Technical Check: After a decent July, August has seen an awful start to the new month with Friday wiping off a decent chunk of July’s gains already. From a technical standpoint the constructive take is that we’re just back to short-term support, but the cautious take is that 50-day breadth is rolling over from overbought levels (and bearish divergence) —and the selloff might need to run a bit further to get things to oversold conditions.
